Immigrants from Uganda vs Scandinavian Divorced or Separated
COMPARE
Immigrants from Uganda
Scandinavian
Divorced or Separated
Divorced or Separated Comparison
Immigrants from Uganda
Scandinavians
11.7%
DIVORCED OR SEPARATED
95.3/ 100
METRIC RATING
117th/ 347
METRIC RANK
12.3%
DIVORCED OR SEPARATED
10.4/ 100
METRIC RATING
223rd/ 347
METRIC RANK
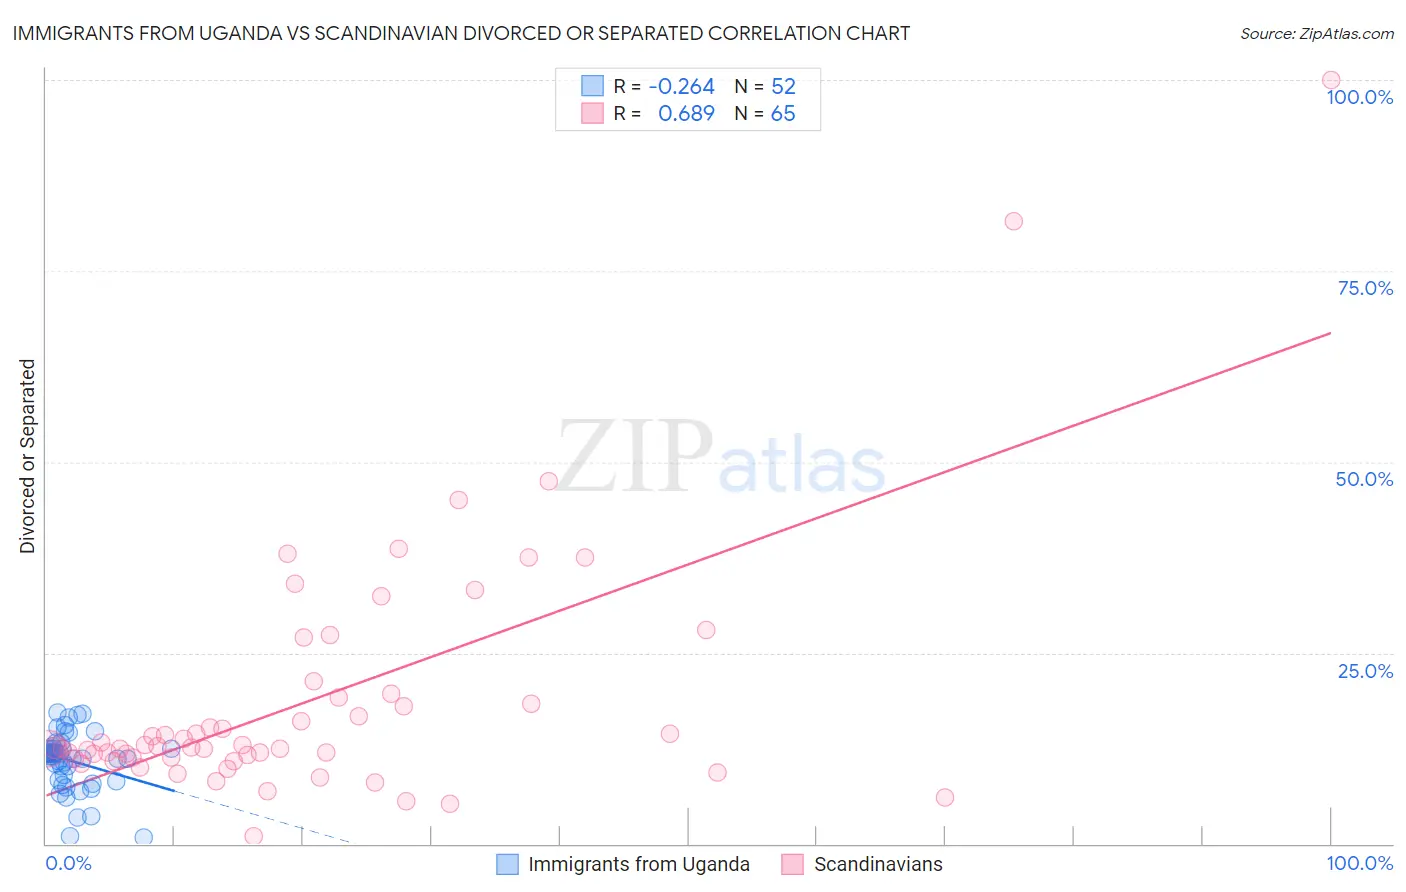
Immigrants from Uganda vs Scandinavian Divorced or Separated Correlation Chart
The statistical analysis conducted on geographies consisting of 125,976,445 people shows a weak negative correlation between the proportion of Immigrants from Uganda and percentage of population currently divorced or separated in the United States with a correlation coefficient (R) of -0.264 and weighted average of 11.7%. Similarly, the statistical analysis conducted on geographies consisting of 472,421,001 people shows a significant positive correlation between the proportion of Scandinavians and percentage of population currently divorced or separated in the United States with a correlation coefficient (R) of 0.689 and weighted average of 12.3%, a difference of 4.6%.
Divorced or Separated Correlation Summary
| Measurement | Immigrants from Uganda | Scandinavian |
| Minimum | 0.80% | 1.0% |
| Maximum | 17.2% | 100.0% |
| Range | 16.4% | 99.0% |
| Mean | 10.9% | 18.9% |
| Median | 11.7% | 12.6% |
| Interquartile 25% (IQ1) | 8.7% | 11.2% |
| Interquartile 75% (IQ3) | 12.5% | 19.4% |
| Interquartile Range (IQR) | 3.8% | 8.2% |
| Standard Deviation (Sample) | 3.7% | 16.4% |
| Standard Deviation (Population) | 3.7% | 16.3% |
Similar Demographics by Divorced or Separated
Demographics Similar to Immigrants from Uganda by Divorced or Separated
In terms of divorced or separated, the demographic groups most similar to Immigrants from Uganda are Ecuadorian (11.7%, a difference of 0.0%), Immigrants from Iraq (11.7%, a difference of 0.020%), Syrian (11.7%, a difference of 0.050%), Lithuanian (11.7%, a difference of 0.080%), and Immigrants from Norway (11.7%, a difference of 0.13%).
| Demographics | Rating | Rank | Divorced or Separated |
| Immigrants | Czechoslovakia | 96.9 /100 | #110 | Exceptional 11.7% |
| Immigrants | Spain | 96.8 /100 | #111 | Exceptional 11.7% |
| Immigrants | France | 96.6 /100 | #112 | Exceptional 11.7% |
| Estonians | 96.6 /100 | #113 | Exceptional 11.7% |
| Immigrants | Norway | 95.9 /100 | #114 | Exceptional 11.7% |
| Lithuanians | 95.7 /100 | #115 | Exceptional 11.7% |
| Immigrants | Iraq | 95.4 /100 | #116 | Exceptional 11.7% |
| Immigrants | Uganda | 95.3 /100 | #117 | Exceptional 11.7% |
| Ecuadorians | 95.3 /100 | #118 | Exceptional 11.7% |
| Syrians | 95.1 /100 | #119 | Exceptional 11.7% |
| Iraqis | 94.6 /100 | #120 | Exceptional 11.8% |
| Romanians | 94.5 /100 | #121 | Exceptional 11.8% |
| Menominee | 93.8 /100 | #122 | Exceptional 11.8% |
| Immigrants | Immigrants | 93.7 /100 | #123 | Exceptional 11.8% |
| Ugandans | 93.1 /100 | #124 | Exceptional 11.8% |
Demographics Similar to Scandinavians by Divorced or Separated
In terms of divorced or separated, the demographic groups most similar to Scandinavians are Bangladeshi (12.3%, a difference of 0.010%), Immigrants from the Azores (12.3%, a difference of 0.070%), Belgian (12.3%, a difference of 0.070%), Guamanian/Chamorro (12.3%, a difference of 0.080%), and Immigrants from Western Africa (12.3%, a difference of 0.10%).
| Demographics | Rating | Rank | Divorced or Separated |
| Immigrants | South America | 15.4 /100 | #216 | Poor 12.2% |
| Northern Europeans | 14.7 /100 | #217 | Poor 12.2% |
| Slovenes | 13.2 /100 | #218 | Poor 12.3% |
| Czechoslovakians | 11.7 /100 | #219 | Poor 12.3% |
| British | 11.6 /100 | #220 | Poor 12.3% |
| Guamanians/Chamorros | 11.3 /100 | #221 | Poor 12.3% |
| Bangladeshis | 10.5 /100 | #222 | Poor 12.3% |
| Scandinavians | 10.4 /100 | #223 | Poor 12.3% |
| Immigrants | Azores | 9.7 /100 | #224 | Tragic 12.3% |
| Belgians | 9.7 /100 | #225 | Tragic 12.3% |
| Immigrants | Western Africa | 9.3 /100 | #226 | Tragic 12.3% |
| Hmong | 8.8 /100 | #227 | Tragic 12.3% |
| Immigrants | Cameroon | 8.3 /100 | #228 | Tragic 12.3% |
| Immigrants | Sudan | 8.2 /100 | #229 | Tragic 12.3% |
| Yakama | 7.8 /100 | #230 | Tragic 12.3% |