Immigrants from Sweden vs American Divorced or Separated

COMPARE

Immigrants from Sweden
Race
Ancestry
AfghanAfricanAlaska NativeAlaskan AthabascanAlbanianAleutAlsatianApacheArabArapahoArgentineanArmenianAssyrian/Chaldean/SyriacAustralianAustrianBahamianBangladeshiBarbadianBasqueBelgianBelizeanBermudanBhutaneseBlackfeetBolivianBrazilianBritishBritish West IndianBulgarianBurmeseCajunCambodianCanadianCape VerdeanCarpatho RusynCelticCentral AmericanCentral American IndianCherokeeCheyenneChickasawChileanChineseChippewaChoctawColombianColvilleComancheCosta RicanCreeCreekCroatianCrowCubanCypriotCzechCzechoslovakianDanishDelawareDominicanDutchDutch West IndianEastern EuropeanEcuadorianEgyptianEnglishEstonianEthiopianEuropeanFijianFilipinoFinnishFrenchFrench American IndianFrench CanadianGermanGerman RussianGhanaianGreekGuamanian/ChamorroGuatemalanGuyaneseHaitianHmongHonduranHopiHoumaHungarianIcelanderIndian (Asian)IndonesianInupiatIranianIraqiIrishIroquoisIsraeliItalianJamaicanJapaneseJordanianKenyanKiowaKoreanLaotianLatvianLebaneseLiberianLithuanianLumbeeLuxembourgerMacedonianMalaysianMalteseMarshalleseMenomineeMexicanMexican American IndianMongolianMoroccanNative HawaiianNavajoNepaleseNew ZealanderNicaraguanNigerianNorthern EuropeanNorwegianOkinawanOsageOttawaPaiutePakistaniPalestinianPanamanianParaguayanPennsylvania GermanPeruvianPimaPolishPortuguesePotawatomiPuebloPuerto RicanPuget Sound SalishRomanianRussianSalvadoranSamoanScandinavianScotch-IrishScottishSeminoleSenegaleseSerbianShoshoneSierra LeoneanSiouxSlavicSlovakSloveneSomaliSouth AfricanSouth AmericanSouth American IndianSoviet UnionSpaniardSpanishSpanish AmericanSpanish American IndianSri LankanSubsaharan AfricanSudaneseSwedishSwissSyrianTaiwaneseThaiTlingit-HaidaTohono O'OdhamTonganTrinidadian and TobagonianTsimshianTurkishU.S. Virgin IslanderUgandanUkrainianUruguayanUteVenezuelanVietnameseWelshWest IndianYakamaYaquiYugoslavianYumanYup'ikZimbabwean
Immigration
NonimmigrantsImmigrantsAfghanistanAfricaAlbaniaArgentinaArmeniaAsiaAustraliaAustriaBahamasBangladeshBarbadosBelarusBelgiumBelizeBoliviaBosnia and HerzegovinaBrazilBulgariaBurma/MyanmarCabo VerdeCambodiaCameroonCanadaCaribbeanCentral AmericaChileChinaColombiaCongoCosta RicaCroatiaCubaCzechoslovakiaDenmarkDominicaDominican RepublicEastern AfricaEastern AsiaEastern EuropeEcuadorEgyptEl SalvadorEnglandEritreaEthiopiaEuropeFijiFranceGermanyGhanaGreeceGrenadaGuatemalaGuyanaHaitiHondurasHong KongHungaryIndiaIndonesiaIranIraqIrelandIsraelItalyJamaicaJapanJordanKazakhstanKenyaKoreaKuwaitLaosLatin AmericaLatviaLebanonLiberiaLithuaniaMalaysiaMexicoMicronesiaMiddle AfricaMoldovaMoroccoNepalNetherlandsNicaraguaNigeriaNorth AmericaNorth MacedoniaNorthern AfricaNorthern EuropeNorwayOceaniaPakistanPanamaPeruPhilippinesPolandPortugalRomaniaRussiaSaudi ArabiaScotlandSenegalSerbiaSierra LeoneSingaporeSomaliaSouth AfricaSouth AmericaSouth Central AsiaSouth Eastern AsiaSouthern EuropeSpainSri LankaSt. Vincent and the GrenadinesSudanSwedenSwitzerlandSyriaTaiwanThailandTrinidad and TobagoTurkeyUgandaUkraineUruguayUzbekistanVenezuelaVietnamWest IndiesWestern AfricaWestern AsiaWestern EuropeYemenZaireZimbabweAzores
American
Race
Ancestry
AfghanAfricanAlaska NativeAlaskan AthabascanAlbanianAleutAlsatianAmericanApacheArabArapahoArgentineanArmenianAssyrian/Chaldean/SyriacAustralianAustrianBahamianBangladeshiBarbadianBasqueBelgianBelizeanBermudanBhutaneseBlackfeetBolivianBrazilianBritishBritish West IndianBulgarianBurmeseCajunCambodianCanadianCape VerdeanCarpatho RusynCelticCentral AmericanCentral American IndianCherokeeCheyenneChickasawChileanChineseChippewaChoctawColombianColvilleComancheCosta RicanCreeCreekCroatianCrowCubanCypriotCzechCzechoslovakianDanishDelawareDominicanDutchDutch West IndianEastern EuropeanEcuadorianEgyptianEnglishEstonianEthiopianEuropeanFijianFilipinoFinnishFrenchFrench American IndianFrench CanadianGermanGerman RussianGhanaianGreekGuamanian/ChamorroGuatemalanGuyaneseHaitianHmongHonduranHopiHoumaHungarianIcelanderIndian (Asian)IndonesianInupiatIranianIraqiIrishIroquoisIsraeliItalianJamaicanJapaneseJordanianKenyanKiowaKoreanLaotianLatvianLebaneseLiberianLithuanianLumbeeLuxembourgerMacedonianMalaysianMalteseMarshalleseMenomineeMexicanMexican American IndianMongolianMoroccanNative HawaiianNavajoNepaleseNew ZealanderNicaraguanNigerianNorthern EuropeanNorwegianOkinawanOsageOttawaPaiutePakistaniPalestinianPanamanianParaguayanPennsylvania GermanPeruvianPimaPolishPortuguesePotawatomiPuebloPuerto RicanPuget Sound SalishRomanianRussianSalvadoranSamoanScandinavianScotch-IrishScottishSeminoleSenegaleseSerbianShoshoneSierra LeoneanSiouxSlavicSlovakSloveneSomaliSouth AfricanSouth AmericanSouth American IndianSoviet UnionSpaniardSpanishSpanish AmericanSpanish American IndianSri LankanSubsaharan AfricanSudaneseSwedishSwissSyrianTaiwaneseThaiTlingit-HaidaTohono O'OdhamTonganTrinidadian and TobagonianTsimshianTurkishU.S. Virgin IslanderUgandanUkrainianUruguayanUteVenezuelanVietnameseWelshWest IndianYakamaYaquiYugoslavianYumanYup'ikZimbabwean
Immigration
NonimmigrantsImmigrantsAfghanistanAfricaAlbaniaArgentinaArmeniaAsiaAustraliaAustriaBahamasBangladeshBarbadosBelarusBelgiumBelizeBoliviaBosnia and HerzegovinaBrazilBulgariaBurma/MyanmarCabo VerdeCambodiaCameroonCanadaCaribbeanCentral AmericaChileChinaColombiaCongoCosta RicaCroatiaCubaCzechoslovakiaDenmarkDominicaDominican RepublicEastern AfricaEastern AsiaEastern EuropeEcuadorEgyptEl SalvadorEnglandEritreaEthiopiaEuropeFijiFranceGermanyGhanaGreeceGrenadaGuatemalaGuyanaHaitiHondurasHong KongHungaryIndiaIndonesiaIranIraqIrelandIsraelItalyJamaicaJapanJordanKazakhstanKenyaKoreaKuwaitLaosLatin AmericaLatviaLebanonLiberiaLithuaniaMalaysiaMexicoMicronesiaMiddle AfricaMoldovaMoroccoNepalNetherlandsNicaraguaNigeriaNorth AmericaNorth MacedoniaNorthern AfricaNorthern EuropeNorwayOceaniaPakistanPanamaPeruPhilippinesPolandPortugalRomaniaRussiaSaudi ArabiaScotlandSenegalSerbiaSierra LeoneSingaporeSomaliaSouth AfricaSouth AmericaSouth Central AsiaSouth Eastern AsiaSouthern EuropeSpainSri LankaSt. Vincent and the GrenadinesSudanSwitzerlandSyriaTaiwanThailandTrinidad and TobagoTurkeyUgandaUkraineUruguayUzbekistanVenezuelaVietnamWest IndiesWestern AfricaWestern AsiaWestern EuropeYemenZaireZimbabweAzores
Divorced or Separated
Income
Poverty
Unemployment
Labor Participation
Family Structure
Vehicle Availability
Education Level
Disability

Divorced or Separated Comparison

Immigrants from Sweden

Americans

Exceptional
Tragic
11.6%
DIVORCED OR SEPARATED
98.6/ 100
METRIC RATING
99th/ 347
METRIC RANK
13.2%
DIVORCED OR SEPARATED
0.0/ 100
METRIC RATING
309th/ 347
METRIC RANK

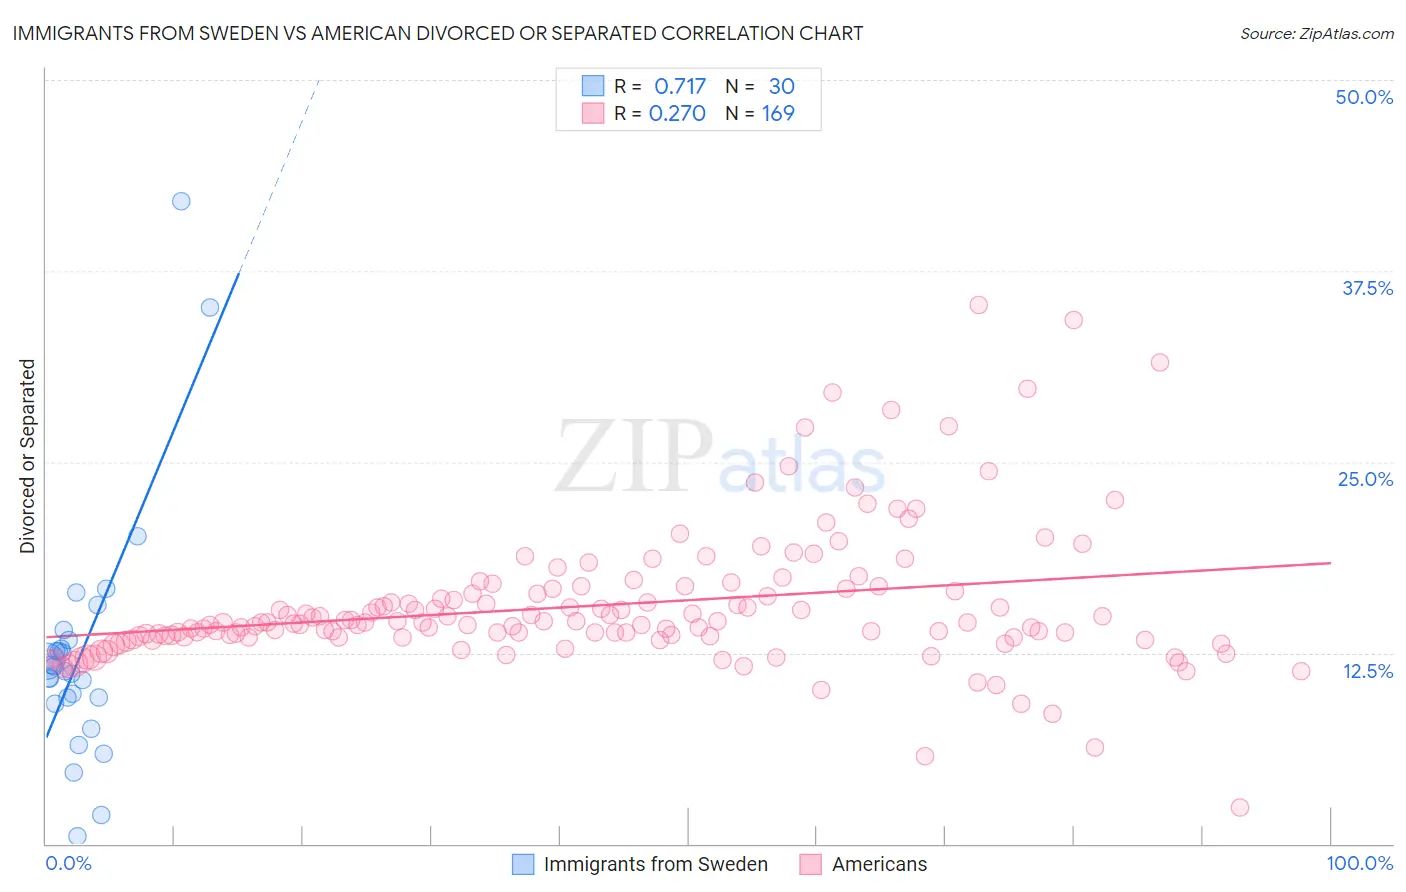
Immigrants from Sweden vs American Divorced or Separated Correlation Chart

The statistical analysis conducted on geographies consisting of 164,719,872 people shows a strong positive correlation between the proportion of Immigrants from Sweden and percentage of population currently divorced or separated in the United States with a correlation coefficient (R) of 0.717 and weighted average of 11.6%. Similarly, the statistical analysis conducted on geographies consisting of 581,440,230 people shows a weak positive correlation between the proportion of Americans and percentage of population currently divorced or separated in the United States with a correlation coefficient (R) of 0.270 and weighted average of 13.2%, a difference of 14.0%.
Immigrants from Sweden vs American Divorced or Separated

Divorced or Separated Correlation Summary

MeasurementImmigrants from SwedenAmerican
Minimum0.50%2.4%
Maximum42.1%35.3%
Range41.6%32.9%
Mean12.6%15.6%
Median11.5%14.5%
Interquartile 25% (IQ1)9.6%13.5%
Interquartile 75% (IQ3)13.4%16.6%
Interquartile Range (IQR)3.8%3.1%
Standard Deviation (Sample)8.2%4.6%
Standard Deviation (Population)8.1%4.6%

Similar Demographics by Divorced or Separated

Demographics Similar to Immigrants from Sweden by Divorced or Separated

In terms of divorced or separated, the demographic groups most similar to Immigrants from Sweden are Immigrants from Jordan (11.6%, a difference of 0.020%), Immigrants from Northern Europe (11.6%, a difference of 0.030%), Latvian (11.6%, a difference of 0.060%), Immigrants from Guyana (11.6%, a difference of 0.070%), and Immigrants from Ukraine (11.6%, a difference of 0.080%).
DemographicsRating | RankDivorced or Separated
Immigrants | Denmark
98.9
/100
|
#92
Exceptional
11.6%
Arabs
98.9
/100
|
#93
Exceptional
11.6%
Immigrants | Fiji
98.9
/100
|
#94
Exceptional
11.6%
Immigrants | Serbia
98.8
/100
|
#95
Exceptional
11.6%
Immigrants | Ukraine
98.7
/100
|
#96
Exceptional
11.6%
Latvians
98.7
/100
|
#97
Exceptional
11.6%
Immigrants | Jordan
98.6
/100
|
#98
Exceptional
11.6%
Immigrants | Sweden
98.6
/100
|
#99
Exceptional
11.6%
Immigrants | Northern Europe
98.6
/100
|
#100
Exceptional
11.6%
Immigrants | Guyana
98.5
/100
|
#101
Exceptional
11.6%
Immigrants | Croatia
98.3
/100
|
#102
Exceptional
11.6%
Maltese
98.2
/100
|
#103
Exceptional
11.6%
Salvadorans
98.2
/100
|
#104
Exceptional
11.6%
Immigrants | El Salvador
97.9
/100
|
#105
Exceptional
11.7%
Immigrants | Kazakhstan
97.8
/100
|
#106
Exceptional
11.7%

Demographics Similar to Americans by Divorced or Separated

In terms of divorced or separated, the demographic groups most similar to Americans are Ottawa (13.2%, a difference of 0.010%), African (13.2%, a difference of 0.020%), Sioux (13.2%, a difference of 0.040%), French American Indian (13.2%, a difference of 0.10%), and Tlingit-Haida (13.2%, a difference of 0.35%).
DemographicsRating | RankDivorced or Separated
Immigrants | Venezuela
0.0
/100
|
#302
Tragic
13.1%
Cape Verdeans
0.0
/100
|
#303
Tragic
13.1%
Hopi
0.0
/100
|
#304
Tragic
13.2%
Chippewa
0.0
/100
|
#305
Tragic
13.2%
Tlingit-Haida
0.0
/100
|
#306
Tragic
13.2%
French American Indians
0.0
/100
|
#307
Tragic
13.2%
Ottawa
0.0
/100
|
#308
Tragic
13.2%
Americans
0.0
/100
|
#309
Tragic
13.2%
Africans
0.0
/100
|
#310
Tragic
13.2%
Sioux
0.0
/100
|
#311
Tragic
13.2%
Blackfeet
0.0
/100
|
#312
Tragic
13.3%
Immigrants | Nicaragua
0.0
/100
|
#313
Tragic
13.3%
Yaqui
0.0
/100
|
#314
Tragic
13.3%
Spanish Americans
0.0
/100
|
#315
Tragic
13.3%
Tsimshian
0.0
/100
|
#316
Tragic
13.3%