Immigrants from Sudan vs German Family Households with Children
COMPARE
Immigrants from Sudan
German
Family Households with Children
Family Households with Children Comparison
Immigrants from Sudan
Germans
27.3%
FAMILY HOUSEHOLDS WITH CHILDREN
21.6/ 100
METRIC RATING
204th/ 347
METRIC RANK
27.1%
FAMILY HOUSEHOLDS WITH CHILDREN
8.7/ 100
METRIC RATING
224th/ 347
METRIC RANK
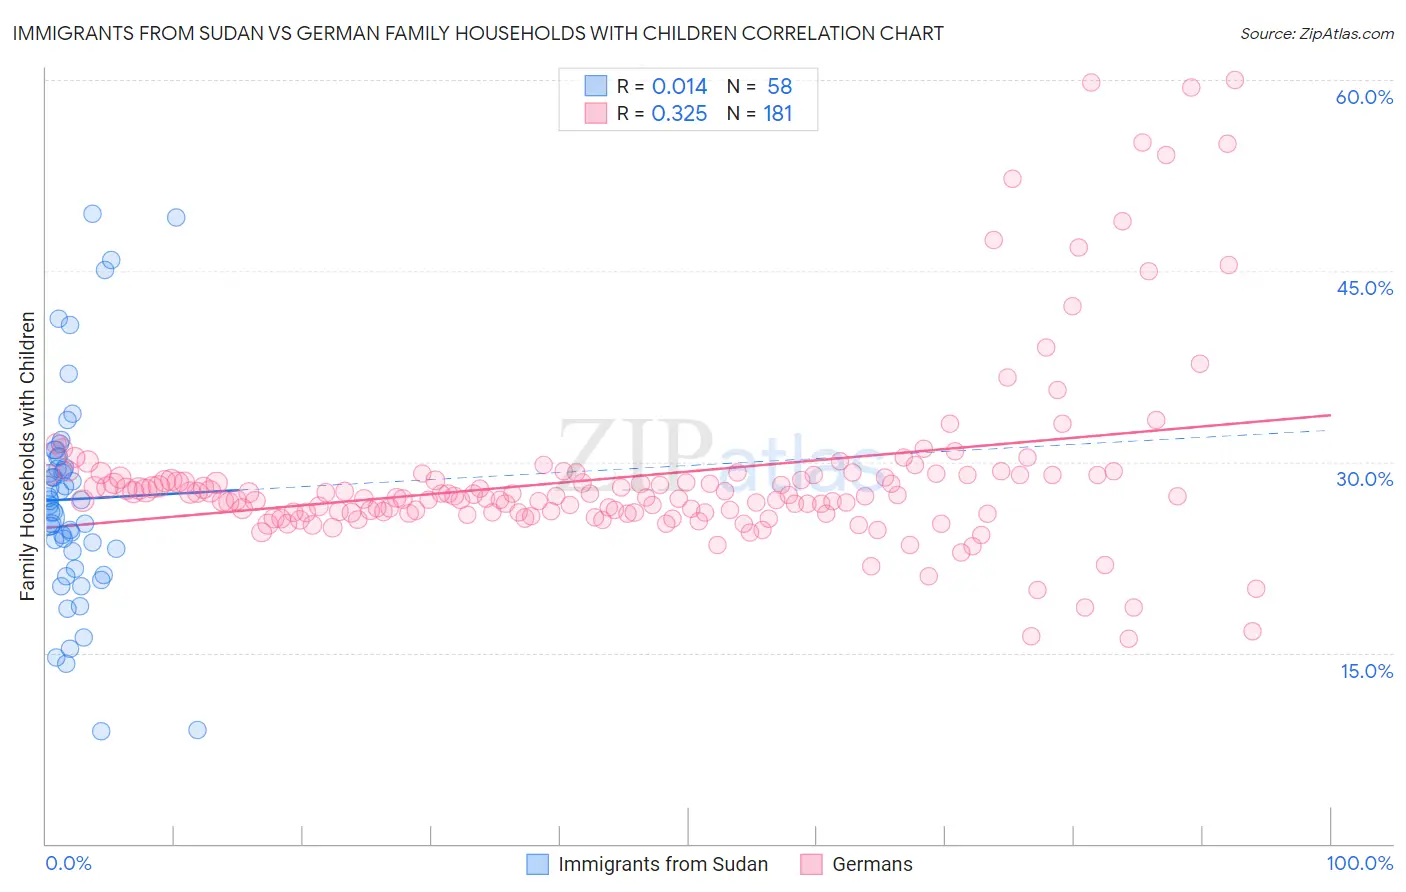
Immigrants from Sudan vs German Family Households with Children Correlation Chart
The statistical analysis conducted on geographies consisting of 118,939,836 people shows no correlation between the proportion of Immigrants from Sudan and percentage of family households with children in the United States with a correlation coefficient (R) of 0.014 and weighted average of 27.3%. Similarly, the statistical analysis conducted on geographies consisting of 579,972,630 people shows a mild positive correlation between the proportion of Germans and percentage of family households with children in the United States with a correlation coefficient (R) of 0.325 and weighted average of 27.1%, a difference of 0.59%.
Family Households with Children Correlation Summary
| Measurement | Immigrants from Sudan | German |
| Minimum | 8.8% | 16.1% |
| Maximum | 49.5% | 60.0% |
| Range | 40.7% | 43.9% |
| Mean | 27.1% | 28.8% |
| Median | 26.8% | 27.3% |
| Interquartile 25% (IQ1) | 22.9% | 26.0% |
| Interquartile 75% (IQ3) | 30.4% | 29.0% |
| Interquartile Range (IQR) | 7.4% | 3.0% |
| Standard Deviation (Sample) | 8.5% | 7.2% |
| Standard Deviation (Population) | 8.4% | 7.2% |
Demographics Similar to Immigrants from Sudan and Germans by Family Households with Children
In terms of family households with children, the demographic groups most similar to Immigrants from Sudan are Immigrants from Haiti (27.2%, a difference of 0.050%), Immigrants from Micronesia (27.2%, a difference of 0.050%), Haitian (27.2%, a difference of 0.060%), Immigrants from Poland (27.2%, a difference of 0.19%), and Dutch West Indian (27.2%, a difference of 0.22%). Similarly, the demographic groups most similar to Germans are Pima (27.1%, a difference of 0.030%), Paraguayan (27.1%, a difference of 0.050%), New Zealander (27.1%, a difference of 0.060%), Austrian (27.1%, a difference of 0.080%), and Immigrants from Japan (27.1%, a difference of 0.13%).
| Demographics | Rating | Rank | Family Households with Children |
| Immigrants | Sudan | 21.6 /100 | #204 | Fair 27.3% |
| Immigrants | Haiti | 20.3 /100 | #205 | Fair 27.2% |
| Immigrants | Micronesia | 20.2 /100 | #206 | Fair 27.2% |
| Haitians | 19.8 /100 | #207 | Poor 27.2% |
| Immigrants | Poland | 16.4 /100 | #208 | Poor 27.2% |
| Dutch West Indians | 15.8 /100 | #209 | Poor 27.2% |
| Immigrants | Ukraine | 14.4 /100 | #210 | Poor 27.2% |
| Welsh | 14.2 /100 | #211 | Poor 27.2% |
| Immigrants | Dominica | 13.9 /100 | #212 | Poor 27.2% |
| Okinawans | 13.7 /100 | #213 | Poor 27.2% |
| Africans | 13.0 /100 | #214 | Poor 27.2% |
| Northern Europeans | 12.8 /100 | #215 | Poor 27.2% |
| Cubans | 12.2 /100 | #216 | Poor 27.1% |
| U.S. Virgin Islanders | 12.1 /100 | #217 | Poor 27.1% |
| Greeks | 11.4 /100 | #218 | Poor 27.1% |
| Immigrants | Japan | 10.7 /100 | #219 | Poor 27.1% |
| Austrians | 9.9 /100 | #220 | Tragic 27.1% |
| New Zealanders | 9.6 /100 | #221 | Tragic 27.1% |
| Paraguayans | 9.4 /100 | #222 | Tragic 27.1% |
| Pima | 9.2 /100 | #223 | Tragic 27.1% |
| Germans | 8.7 /100 | #224 | Tragic 27.1% |