Immigrants from St. Vincent and the Grenadines vs Burmese Single Father Households
COMPARE
Immigrants from St. Vincent and the Grenadines
Burmese
Single Father Households
Single Father Households Comparison
Immigrants from St. Vincent and the Grenadines
Burmese
2.0%
SINGLE FATHER HOUSEHOLDS
100.0/ 100
METRIC RATING
37th/ 347
METRIC RANK
2.0%
SINGLE FATHER HOUSEHOLDS
99.9/ 100
METRIC RATING
57th/ 347
METRIC RANK
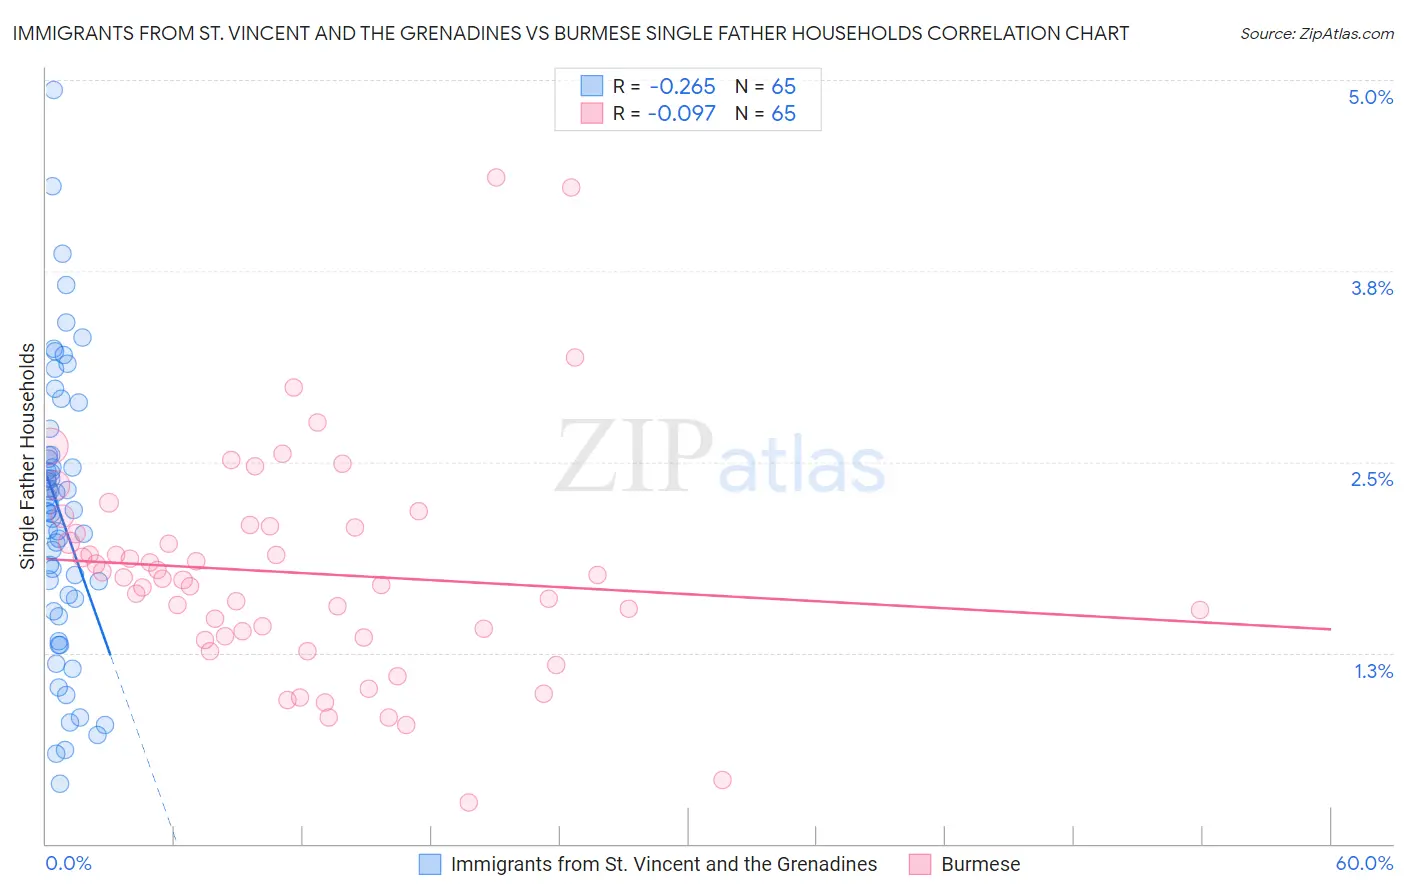
Immigrants from St. Vincent and the Grenadines vs Burmese Single Father Households Correlation Chart
The statistical analysis conducted on geographies consisting of 56,084,027 people shows a weak negative correlation between the proportion of Immigrants from St. Vincent and the Grenadines and percentage of single father households in the United States with a correlation coefficient (R) of -0.265 and weighted average of 2.0%. Similarly, the statistical analysis conducted on geographies consisting of 460,084,605 people shows a slight negative correlation between the proportion of Burmese and percentage of single father households in the United States with a correlation coefficient (R) of -0.097 and weighted average of 2.0%, a difference of 2.4%.
Single Father Households Correlation Summary
| Measurement | Immigrants from St. Vincent and the Grenadines | Burmese |
| Minimum | 0.40% | 0.27% |
| Maximum | 4.9% | 4.4% |
| Range | 4.5% | 4.1% |
| Mean | 2.2% | 1.8% |
| Median | 2.2% | 1.7% |
| Interquartile 25% (IQ1) | 1.6% | 1.4% |
| Interquartile 75% (IQ3) | 2.5% | 2.1% |
| Interquartile Range (IQR) | 0.98% | 0.72% |
| Standard Deviation (Sample) | 0.92% | 0.74% |
| Standard Deviation (Population) | 0.91% | 0.73% |
Demographics Similar to Immigrants from St. Vincent and the Grenadines and Burmese by Single Father Households
In terms of single father households, the demographic groups most similar to Immigrants from St. Vincent and the Grenadines are Immigrants from Eastern Europe (2.0%, a difference of 0.30%), Immigrants from Sri Lanka (2.0%, a difference of 0.30%), Immigrants from Bulgaria (2.0%, a difference of 0.35%), Immigrants from Turkey (2.0%, a difference of 0.53%), and Macedonian (2.0%, a difference of 0.68%). Similarly, the demographic groups most similar to Burmese are Immigrants from Norway (2.0%, a difference of 0.26%), Immigrants from France (2.0%, a difference of 0.29%), Immigrants from Korea (2.0%, a difference of 0.34%), Immigrants from Northern Europe (2.0%, a difference of 0.49%), and Immigrants from Europe (2.0%, a difference of 0.62%).
| Demographics | Rating | Rank | Single Father Households |
| Immigrants | St. Vincent and the Grenadines | 100.0 /100 | #37 | Exceptional 2.0% |
| Immigrants | Eastern Europe | 100.0 /100 | #38 | Exceptional 2.0% |
| Immigrants | Sri Lanka | 100.0 /100 | #39 | Exceptional 2.0% |
| Immigrants | Bulgaria | 100.0 /100 | #40 | Exceptional 2.0% |
| Immigrants | Turkey | 100.0 /100 | #41 | Exceptional 2.0% |
| Macedonians | 100.0 /100 | #42 | Exceptional 2.0% |
| Immigrants | Grenada | 100.0 /100 | #43 | Exceptional 2.0% |
| Latvians | 100.0 /100 | #44 | Exceptional 2.0% |
| Russians | 100.0 /100 | #45 | Exceptional 2.0% |
| Immigrants | Lebanon | 100.0 /100 | #46 | Exceptional 2.0% |
| Immigrants | Ukraine | 99.9 /100 | #47 | Exceptional 2.0% |
| Immigrants | Kazakhstan | 99.9 /100 | #48 | Exceptional 2.0% |
| Immigrants | Serbia | 99.9 /100 | #49 | Exceptional 2.0% |
| Immigrants | Switzerland | 99.9 /100 | #50 | Exceptional 2.0% |
| Immigrants | Poland | 99.9 /100 | #51 | Exceptional 2.0% |
| Immigrants | Europe | 99.9 /100 | #52 | Exceptional 2.0% |
| Immigrants | Northern Europe | 99.9 /100 | #53 | Exceptional 2.0% |
| Immigrants | Korea | 99.9 /100 | #54 | Exceptional 2.0% |
| Immigrants | France | 99.9 /100 | #55 | Exceptional 2.0% |
| Immigrants | Norway | 99.9 /100 | #56 | Exceptional 2.0% |
| Burmese | 99.9 /100 | #57 | Exceptional 2.0% |