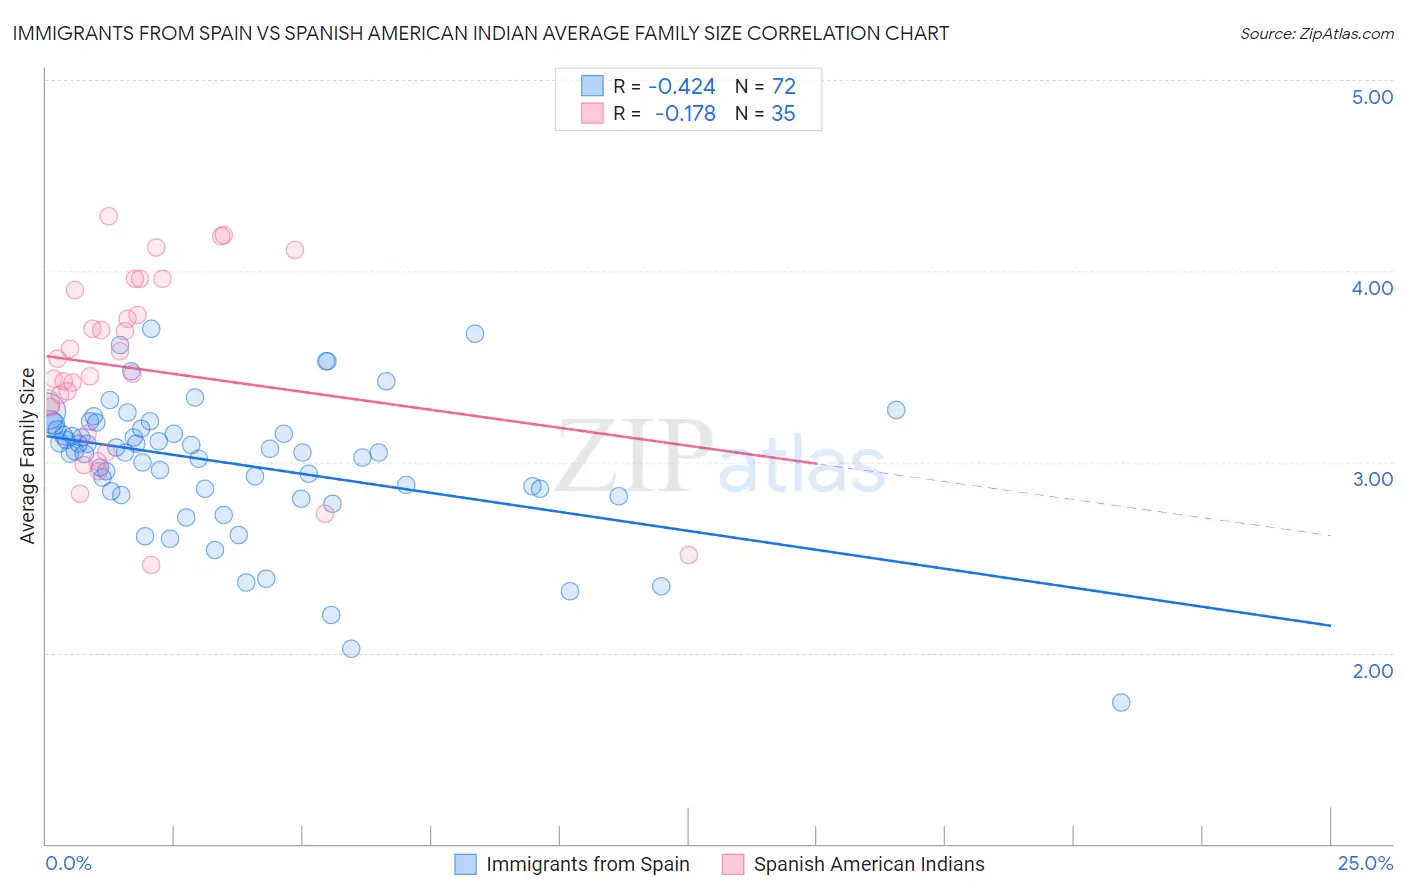
Immigrants from Spain vs Spanish American Indian Average Family Size
COMPARE
Immigrants from Spain
Spanish American Indian
Average Family Size
Average Family Size Comparison
Immigrants from Spain
Spanish American Indians
3.17
AVERAGE FAMILY SIZE
1.8/ 100
METRIC RATING
251st/ 347
METRIC RANK
3.58
AVERAGE FAMILY SIZE
100.0/ 100
METRIC RATING
10th/ 347
METRIC RANK
Immigrants from Spain vs Spanish American Indian Average Family Size Correlation Chart
The statistical analysis conducted on geographies consisting of 239,606,495 people shows a moderate negative correlation between the proportion of Immigrants from Spain and average family size in the United States with a correlation coefficient (R) of -0.424 and weighted average of 3.17. Similarly, the statistical analysis conducted on geographies consisting of 73,145,550 people shows a poor negative correlation between the proportion of Spanish American Indians and average family size in the United States with a correlation coefficient (R) of -0.178 and weighted average of 3.58, a difference of 13.1%.
Average Family Size Correlation Summary
| Measurement | Immigrants from Spain | Spanish American Indian |
| Minimum | 1.74 | 2.46 |
| Maximum | 3.70 | 4.29 |
| Range | 1.96 | 1.83 |
| Mean | 2.99 | 3.49 |
| Median | 3.05 | 3.46 |
| Interquartile 25% (IQ1) | 2.85 | 3.15 |
| Interquartile 75% (IQ3) | 3.19 | 3.90 |
| Interquartile Range (IQR) | 0.33 | 0.75 |
| Standard Deviation (Sample) | 0.36 | 0.48 |
| Standard Deviation (Population) | 0.36 | 0.47 |
Similar Demographics by Average Family Size
Demographics Similar to Immigrants from Spain by Average Family Size
In terms of average family size, the demographic groups most similar to Immigrants from Spain are Puget Sound Salish (3.17, a difference of 0.010%), Immigrants from Saudi Arabia (3.17, a difference of 0.030%), South African (3.17, a difference of 0.030%), Immigrants from Hungary (3.17, a difference of 0.040%), and Cape Verdean (3.17, a difference of 0.050%).
| Demographics | Rating | Rank | Average Family Size |
| Immigrants | Southern Europe | 2.9 /100 | #244 | Tragic 3.18 |
| Immigrants | Brazil | 2.7 /100 | #245 | Tragic 3.18 |
| Danes | 2.5 /100 | #246 | Tragic 3.17 |
| Cajuns | 2.4 /100 | #247 | Tragic 3.17 |
| Immigrants | Belarus | 2.3 /100 | #248 | Tragic 3.17 |
| Immigrants | Eastern Europe | 2.1 /100 | #249 | Tragic 3.17 |
| Puget Sound Salish | 1.9 /100 | #250 | Tragic 3.17 |
| Immigrants | Spain | 1.8 /100 | #251 | Tragic 3.17 |
| Immigrants | Saudi Arabia | 1.7 /100 | #252 | Tragic 3.17 |
| South Africans | 1.7 /100 | #253 | Tragic 3.17 |
| Immigrants | Hungary | 1.7 /100 | #254 | Tragic 3.17 |
| Cape Verdeans | 1.6 /100 | #255 | Tragic 3.17 |
| Immigrants | Kazakhstan | 1.5 /100 | #256 | Tragic 3.17 |
| Albanians | 1.5 /100 | #257 | Tragic 3.17 |
| Turks | 1.3 /100 | #258 | Tragic 3.16 |
Demographics Similar to Spanish American Indians by Average Family Size
In terms of average family size, the demographic groups most similar to Spanish American Indians are Hopi (3.60, a difference of 0.35%), Immigrants from Yemen (3.60, a difference of 0.36%), Inupiat (3.63, a difference of 1.2%), Arapaho (3.64, a difference of 1.4%), and Tohono O'odham (3.53, a difference of 1.4%).
| Demographics | Rating | Rank | Average Family Size |
| Pueblo | 100 /100 | #3 | Exceptional 3.79 |
| Pima | 100 /100 | #4 | Exceptional 3.75 |
| Navajo | 100.0 /100 | #5 | Exceptional 3.65 |
| Arapaho | 100.0 /100 | #6 | Exceptional 3.64 |
| Inupiat | 100.0 /100 | #7 | Exceptional 3.63 |
| Immigrants | Yemen | 100.0 /100 | #8 | Exceptional 3.60 |
| Hopi | 100.0 /100 | #9 | Exceptional 3.60 |
| Spanish American Indians | 100.0 /100 | #10 | Exceptional 3.58 |
| Tohono O'odham | 100.0 /100 | #11 | Exceptional 3.53 |
| Immigrants | Mexico | 100.0 /100 | #12 | Exceptional 3.52 |
| Sioux | 100.0 /100 | #13 | Exceptional 3.52 |
| Immigrants | Central America | 100.0 /100 | #14 | Exceptional 3.49 |
| Tongans | 100.0 /100 | #15 | Exceptional 3.49 |
| Ute | 100.0 /100 | #16 | Exceptional 3.49 |
| Immigrants | El Salvador | 100.0 /100 | #17 | Exceptional 3.49 |