Immigrants from Southern Europe vs Choctaw Single Mother Households
COMPARE
Immigrants from Southern Europe
Choctaw
Single Mother Households
Single Mother Households Comparison
Immigrants from Southern Europe
Choctaw
6.1%
SINGLE MOTHER HOUSEHOLDS
80.5/ 100
METRIC RATING
151st/ 347
METRIC RANK
7.0%
SINGLE MOTHER HOUSEHOLDS
1.4/ 100
METRIC RATING
233rd/ 347
METRIC RANK
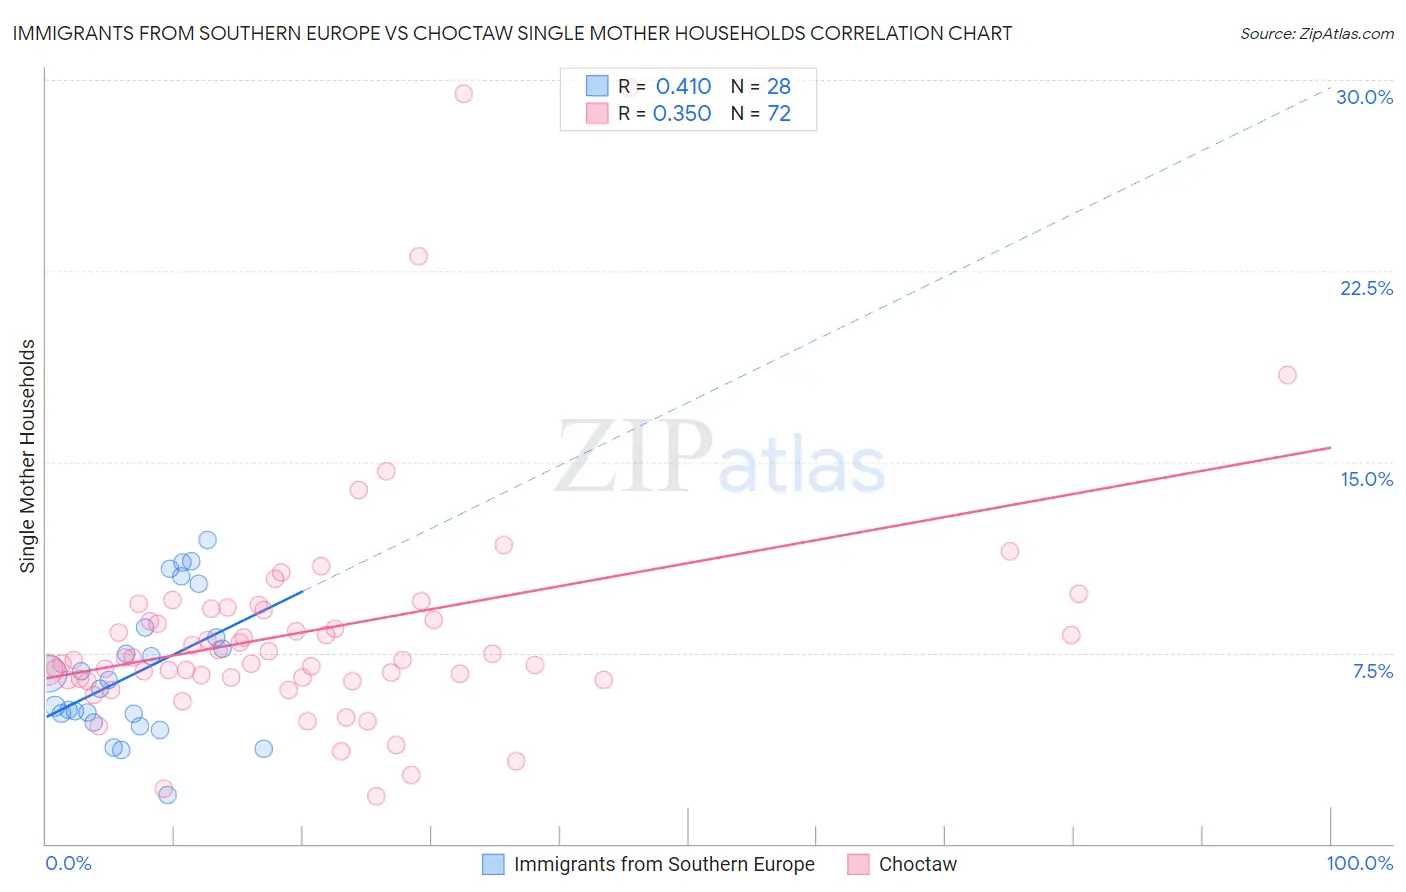
Immigrants from Southern Europe vs Choctaw Single Mother Households Correlation Chart
The statistical analysis conducted on geographies consisting of 401,370,975 people shows a moderate positive correlation between the proportion of Immigrants from Southern Europe and percentage of single mother households in the United States with a correlation coefficient (R) of 0.410 and weighted average of 6.1%. Similarly, the statistical analysis conducted on geographies consisting of 269,186,526 people shows a mild positive correlation between the proportion of Choctaw and percentage of single mother households in the United States with a correlation coefficient (R) of 0.350 and weighted average of 7.0%, a difference of 16.1%.
Single Mother Households Correlation Summary
| Measurement | Immigrants from Southern Europe | Choctaw |
| Minimum | 1.9% | 1.9% |
| Maximum | 11.9% | 29.7% |
| Range | 10.0% | 27.9% |
| Mean | 6.7% | 8.4% |
| Median | 6.3% | 7.3% |
| Interquartile 25% (IQ1) | 4.9% | 6.5% |
| Interquartile 75% (IQ3) | 8.3% | 9.2% |
| Interquartile Range (IQR) | 3.4% | 2.8% |
| Standard Deviation (Sample) | 2.7% | 4.8% |
| Standard Deviation (Population) | 2.6% | 4.8% |
Similar Demographics by Single Mother Households
Demographics Similar to Immigrants from Southern Europe by Single Mother Households
In terms of single mother households, the demographic groups most similar to Immigrants from Southern Europe are Zimbabwean (6.1%, a difference of 0.050%), Immigrants from Albania (6.1%, a difference of 0.19%), Pakistani (6.1%, a difference of 0.23%), Immigrants from Brazil (6.1%, a difference of 0.27%), and Scotch-Irish (6.0%, a difference of 0.30%).
| Demographics | Rating | Rank | Single Mother Households |
| Koreans | 84.4 /100 | #144 | Excellent 6.0% |
| Arabs | 84.0 /100 | #145 | Excellent 6.0% |
| French Canadians | 82.6 /100 | #146 | Excellent 6.0% |
| Immigrants | Jordan | 82.3 /100 | #147 | Excellent 6.0% |
| Scotch-Irish | 82.0 /100 | #148 | Excellent 6.0% |
| Immigrants | Albania | 81.5 /100 | #149 | Excellent 6.1% |
| Zimbabweans | 80.7 /100 | #150 | Excellent 6.1% |
| Immigrants | Southern Europe | 80.5 /100 | #151 | Excellent 6.1% |
| Pakistanis | 79.2 /100 | #152 | Good 6.1% |
| Immigrants | Brazil | 78.9 /100 | #153 | Good 6.1% |
| Immigrants | Philippines | 78.5 /100 | #154 | Good 6.1% |
| Whites/Caucasians | 76.5 /100 | #155 | Good 6.1% |
| Native Hawaiians | 75.0 /100 | #156 | Good 6.1% |
| Chileans | 74.2 /100 | #157 | Good 6.1% |
| Celtics | 73.3 /100 | #158 | Good 6.1% |
Demographics Similar to Choctaw by Single Mother Households
In terms of single mother households, the demographic groups most similar to Choctaw are Chickasaw (7.0%, a difference of 0.020%), Immigrants from Burma/Myanmar (7.0%, a difference of 0.090%), Comanche (7.0%, a difference of 0.17%), Spanish American (7.0%, a difference of 0.23%), and Creek (7.0%, a difference of 0.25%).
| Demographics | Rating | Rank | Single Mother Households |
| Paiute | 2.4 /100 | #226 | Tragic 7.0% |
| Kenyans | 2.3 /100 | #227 | Tragic 7.0% |
| Iroquois | 2.2 /100 | #228 | Tragic 7.0% |
| Immigrants | Kenya | 2.1 /100 | #229 | Tragic 7.0% |
| Creek | 1.6 /100 | #230 | Tragic 7.0% |
| Spanish Americans | 1.6 /100 | #231 | Tragic 7.0% |
| Comanche | 1.5 /100 | #232 | Tragic 7.0% |
| Choctaw | 1.4 /100 | #233 | Tragic 7.0% |
| Chickasaw | 1.4 /100 | #234 | Tragic 7.0% |
| Immigrants | Burma/Myanmar | 1.4 /100 | #235 | Tragic 7.0% |
| Ute | 1.0 /100 | #236 | Tragic 7.1% |
| Arapaho | 1.0 /100 | #237 | Tragic 7.1% |
| Panamanians | 0.9 /100 | #238 | Tragic 7.1% |
| Kiowa | 0.8 /100 | #239 | Tragic 7.1% |
| Immigrants | Panama | 0.7 /100 | #240 | Tragic 7.2% |