Immigrants from Southern Europe vs Assyrian/Chaldean/Syriac Average Family Size
COMPARE
Immigrants from Southern Europe
Assyrian/Chaldean/Syriac
Average Family Size
Average Family Size Comparison
Immigrants from Southern Europe
Assyrians/Chaldeans/Syriacs
3.18
AVERAGE FAMILY SIZE
2.9/ 100
METRIC RATING
244th/ 347
METRIC RANK
3.24
AVERAGE FAMILY SIZE
73.8/ 100
METRIC RATING
149th/ 347
METRIC RANK
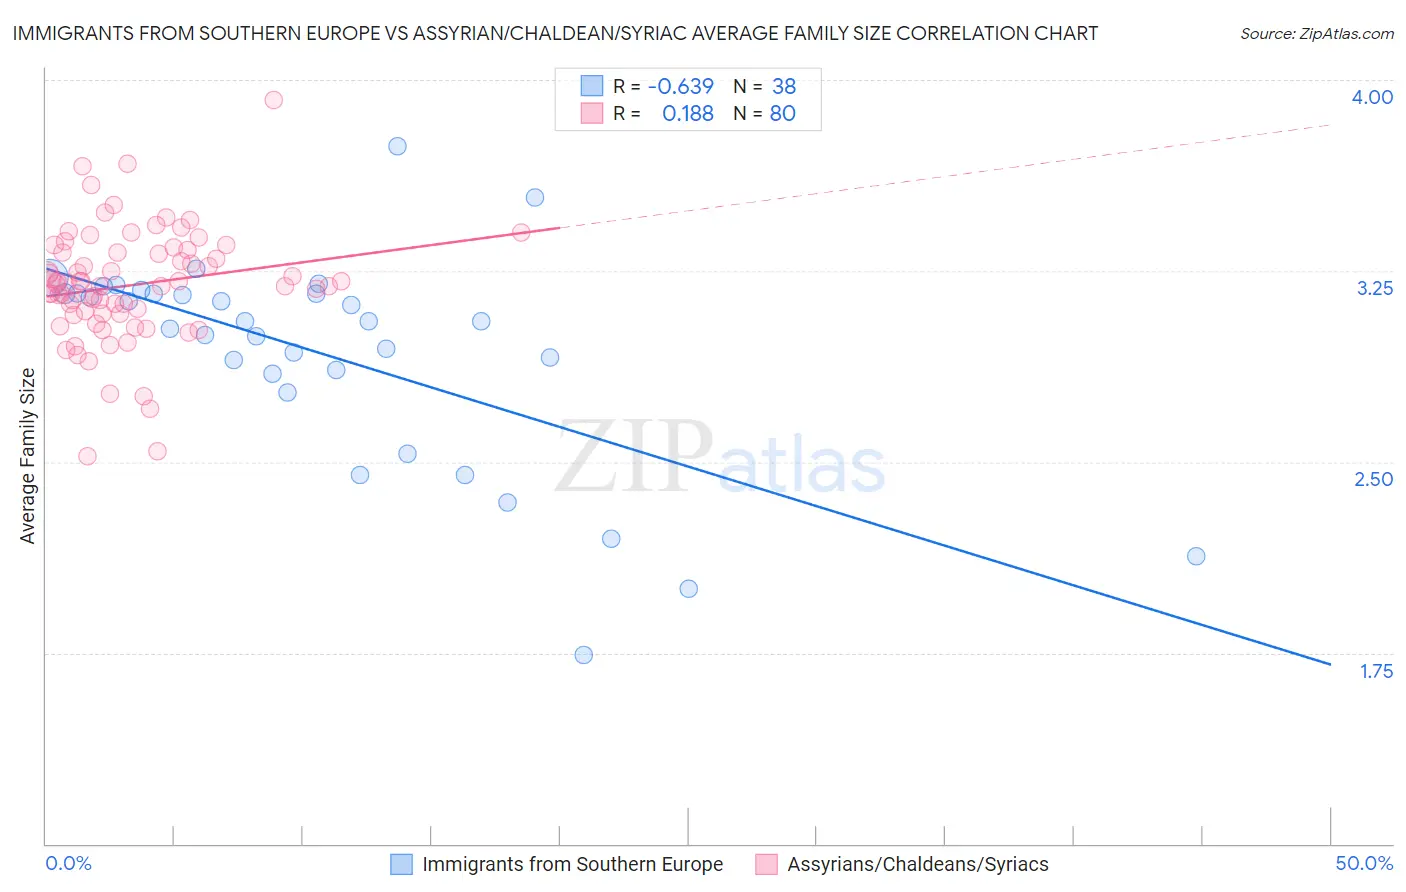
Immigrants from Southern Europe vs Assyrian/Chaldean/Syriac Average Family Size Correlation Chart
The statistical analysis conducted on geographies consisting of 402,630,009 people shows a significant negative correlation between the proportion of Immigrants from Southern Europe and average family size in the United States with a correlation coefficient (R) of -0.639 and weighted average of 3.18. Similarly, the statistical analysis conducted on geographies consisting of 110,294,582 people shows a poor positive correlation between the proportion of Assyrians/Chaldeans/Syriacs and average family size in the United States with a correlation coefficient (R) of 0.188 and weighted average of 3.24, a difference of 2.1%.
Average Family Size Correlation Summary
| Measurement | Immigrants from Southern Europe | Assyrian/Chaldean/Syriac |
| Minimum | 1.74 | 2.52 |
| Maximum | 3.74 | 3.92 |
| Range | 2.00 | 1.40 |
| Mean | 2.92 | 3.20 |
| Median | 3.05 | 3.20 |
| Interquartile 25% (IQ1) | 2.85 | 3.08 |
| Interquartile 75% (IQ3) | 3.16 | 3.33 |
| Interquartile Range (IQR) | 0.32 | 0.25 |
| Standard Deviation (Sample) | 0.42 | 0.23 |
| Standard Deviation (Population) | 0.41 | 0.23 |
Similar Demographics by Average Family Size
Demographics Similar to Immigrants from Southern Europe by Average Family Size
In terms of average family size, the demographic groups most similar to Immigrants from Southern Europe are Hungarian (3.18, a difference of 0.010%), Immigrants from Moldova (3.18, a difference of 0.010%), Immigrants from Japan (3.18, a difference of 0.030%), Immigrants from Brazil (3.18, a difference of 0.030%), and Osage (3.18, a difference of 0.050%).
| Demographics | Rating | Rank | Average Family Size |
| Immigrants | Romania | 3.7 /100 | #237 | Tragic 3.18 |
| Romanians | 3.7 /100 | #238 | Tragic 3.18 |
| Houma | 3.4 /100 | #239 | Tragic 3.18 |
| Osage | 3.2 /100 | #240 | Tragic 3.18 |
| Immigrants | Japan | 3.0 /100 | #241 | Tragic 3.18 |
| Hungarians | 3.0 /100 | #242 | Tragic 3.18 |
| Immigrants | Moldova | 2.9 /100 | #243 | Tragic 3.18 |
| Immigrants | Southern Europe | 2.9 /100 | #244 | Tragic 3.18 |
| Immigrants | Brazil | 2.7 /100 | #245 | Tragic 3.18 |
| Danes | 2.5 /100 | #246 | Tragic 3.17 |
| Cajuns | 2.4 /100 | #247 | Tragic 3.17 |
| Immigrants | Belarus | 2.3 /100 | #248 | Tragic 3.17 |
| Immigrants | Eastern Europe | 2.1 /100 | #249 | Tragic 3.17 |
| Puget Sound Salish | 1.9 /100 | #250 | Tragic 3.17 |
| Immigrants | Spain | 1.8 /100 | #251 | Tragic 3.17 |
Demographics Similar to Assyrians/Chaldeans/Syriacs by Average Family Size
In terms of average family size, the demographic groups most similar to Assyrians/Chaldeans/Syriacs are Indian (Asian) (3.24, a difference of 0.0%), Jordanian (3.24, a difference of 0.010%), Blackfeet (3.24, a difference of 0.030%), Spanish American (3.24, a difference of 0.030%), and Immigrants from Jordan (3.24, a difference of 0.050%).
| Demographics | Rating | Rank | Average Family Size |
| Liberians | 81.2 /100 | #142 | Excellent 3.25 |
| Bhutanese | 81.0 /100 | #143 | Excellent 3.25 |
| Tsimshian | 80.2 /100 | #144 | Excellent 3.25 |
| Armenians | 78.2 /100 | #145 | Good 3.25 |
| Immigrants | Africa | 77.9 /100 | #146 | Good 3.25 |
| Immigrants | Jordan | 75.7 /100 | #147 | Good 3.24 |
| Blackfeet | 75.0 /100 | #148 | Good 3.24 |
| Assyrians/Chaldeans/Syriacs | 73.8 /100 | #149 | Good 3.24 |
| Indians (Asian) | 73.6 /100 | #150 | Good 3.24 |
| Jordanians | 73.5 /100 | #151 | Good 3.24 |
| Spanish Americans | 72.5 /100 | #152 | Good 3.24 |
| Immigrants | Eritrea | 71.4 /100 | #153 | Good 3.24 |
| Immigrants | Egypt | 70.0 /100 | #154 | Good 3.24 |
| Seminole | 68.2 /100 | #155 | Good 3.24 |
| Immigrants | Taiwan | 68.1 /100 | #156 | Good 3.24 |