Immigrants from South Eastern Asia vs Immigrants from Europe Single Father Households
COMPARE
Immigrants from South Eastern Asia
Immigrants from Europe
Single Father Households
Single Father Households Comparison
Immigrants from South Eastern Asia
Immigrants from Europe
2.4%
SINGLE FATHER HOUSEHOLDS
15.9/ 100
METRIC RATING
215th/ 347
METRIC RANK
2.0%
SINGLE FATHER HOUSEHOLDS
99.9/ 100
METRIC RATING
52nd/ 347
METRIC RANK
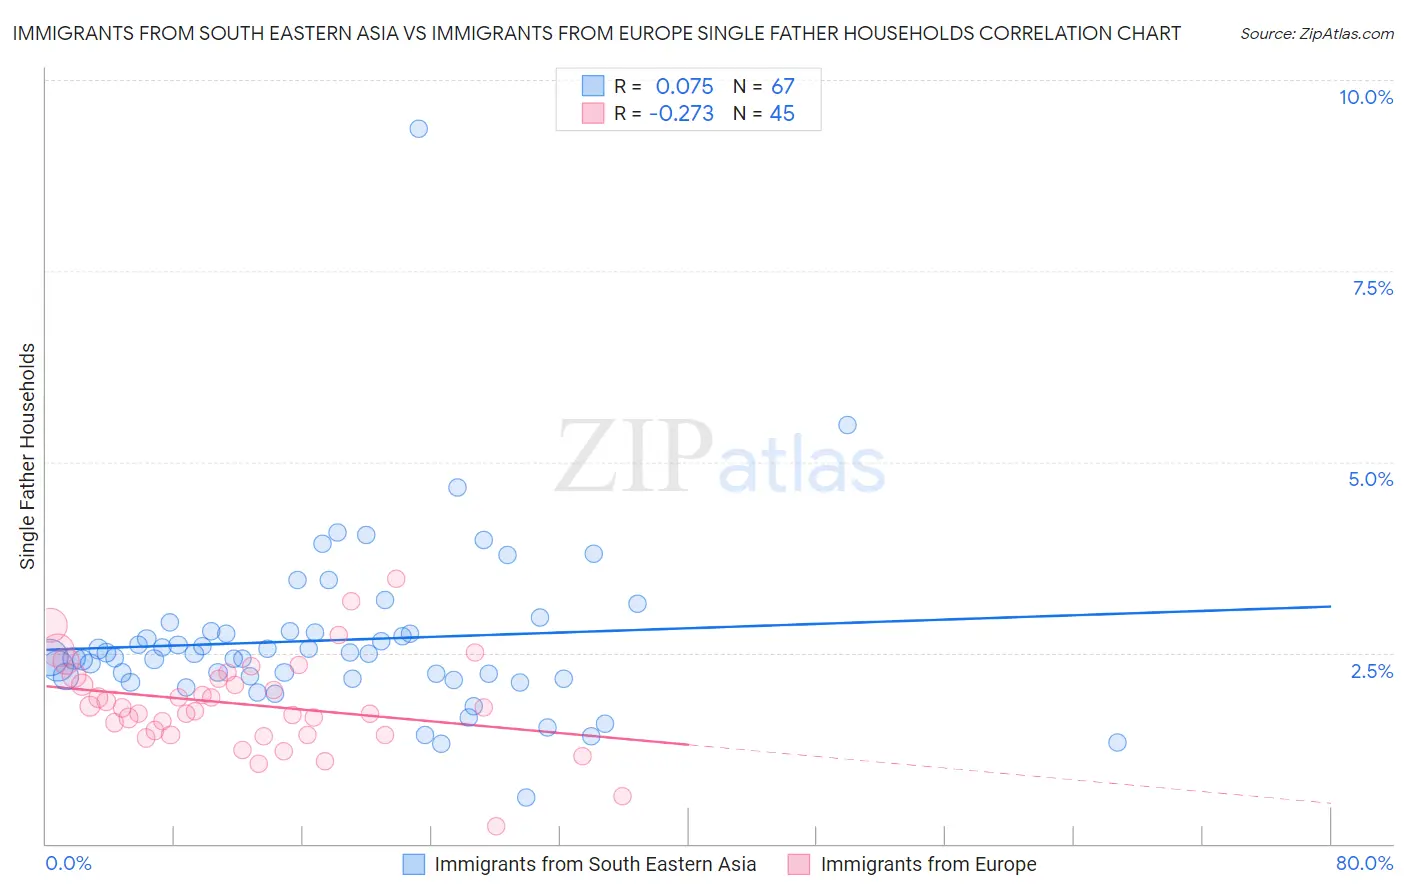
Immigrants from South Eastern Asia vs Immigrants from Europe Single Father Households Correlation Chart
The statistical analysis conducted on geographies consisting of 505,176,076 people shows a slight positive correlation between the proportion of Immigrants from South Eastern Asia and percentage of single father households in the United States with a correlation coefficient (R) of 0.075 and weighted average of 2.4%. Similarly, the statistical analysis conducted on geographies consisting of 536,045,641 people shows a weak negative correlation between the proportion of Immigrants from Europe and percentage of single father households in the United States with a correlation coefficient (R) of -0.273 and weighted average of 2.0%, a difference of 19.2%.
Single Father Households Correlation Summary
| Measurement | Immigrants from South Eastern Asia | Immigrants from Europe |
| Minimum | 0.60% | 0.23% |
| Maximum | 9.4% | 3.5% |
| Range | 8.8% | 3.2% |
| Mean | 2.7% | 1.8% |
| Median | 2.5% | 1.8% |
| Interquartile 25% (IQ1) | 2.2% | 1.4% |
| Interquartile 75% (IQ3) | 2.8% | 2.2% |
| Interquartile Range (IQR) | 0.62% | 0.75% |
| Standard Deviation (Sample) | 1.2% | 0.61% |
| Standard Deviation (Population) | 1.2% | 0.60% |
Similar Demographics by Single Father Households
Demographics Similar to Immigrants from South Eastern Asia by Single Father Households
In terms of single father households, the demographic groups most similar to Immigrants from South Eastern Asia are Ethiopian (2.4%, a difference of 0.090%), Immigrants from Ecuador (2.4%, a difference of 0.13%), Norwegian (2.4%, a difference of 0.16%), Dutch (2.4%, a difference of 0.22%), and Finnish (2.4%, a difference of 0.30%).
| Demographics | Rating | Rank | Single Father Households |
| Immigrants | Kenya | 20.3 /100 | #208 | Fair 2.4% |
| Immigrants | Peru | 19.3 /100 | #209 | Poor 2.4% |
| Immigrants | Costa Rica | 19.2 /100 | #210 | Poor 2.4% |
| Immigrants | Nigeria | 18.7 /100 | #211 | Poor 2.4% |
| Finns | 18.3 /100 | #212 | Poor 2.4% |
| Norwegians | 17.1 /100 | #213 | Poor 2.4% |
| Ethiopians | 16.6 /100 | #214 | Poor 2.4% |
| Immigrants | South Eastern Asia | 15.9 /100 | #215 | Poor 2.4% |
| Immigrants | Ecuador | 14.9 /100 | #216 | Poor 2.4% |
| Dutch | 14.3 /100 | #217 | Poor 2.4% |
| Immigrants | Ethiopia | 13.4 /100 | #218 | Poor 2.4% |
| Sudanese | 13.0 /100 | #219 | Poor 2.4% |
| Ghanaians | 12.9 /100 | #220 | Poor 2.4% |
| Immigrants | Burma/Myanmar | 12.1 /100 | #221 | Poor 2.4% |
| Immigrants | Eastern Africa | 11.9 /100 | #222 | Poor 2.4% |
Demographics Similar to Immigrants from Europe by Single Father Households
In terms of single father households, the demographic groups most similar to Immigrants from Europe are Immigrants from Northern Europe (2.0%, a difference of 0.13%), Immigrants from Switzerland (2.0%, a difference of 0.24%), Immigrants from Poland (2.0%, a difference of 0.24%), Immigrants from Serbia (2.0%, a difference of 0.25%), and Immigrants from Kazakhstan (2.0%, a difference of 0.26%).
| Demographics | Rating | Rank | Single Father Households |
| Russians | 100.0 /100 | #45 | Exceptional 2.0% |
| Immigrants | Lebanon | 100.0 /100 | #46 | Exceptional 2.0% |
| Immigrants | Ukraine | 99.9 /100 | #47 | Exceptional 2.0% |
| Immigrants | Kazakhstan | 99.9 /100 | #48 | Exceptional 2.0% |
| Immigrants | Serbia | 99.9 /100 | #49 | Exceptional 2.0% |
| Immigrants | Switzerland | 99.9 /100 | #50 | Exceptional 2.0% |
| Immigrants | Poland | 99.9 /100 | #51 | Exceptional 2.0% |
| Immigrants | Europe | 99.9 /100 | #52 | Exceptional 2.0% |
| Immigrants | Northern Europe | 99.9 /100 | #53 | Exceptional 2.0% |
| Immigrants | Korea | 99.9 /100 | #54 | Exceptional 2.0% |
| Immigrants | France | 99.9 /100 | #55 | Exceptional 2.0% |
| Immigrants | Norway | 99.9 /100 | #56 | Exceptional 2.0% |
| Burmese | 99.9 /100 | #57 | Exceptional 2.0% |
| Immigrants | Czechoslovakia | 99.9 /100 | #58 | Exceptional 2.0% |
| Immigrants | North Macedonia | 99.9 /100 | #59 | Exceptional 2.0% |