Immigrants from Sierra Leone vs Ukrainian Births to Unmarried Women
COMPARE
Immigrants from Sierra Leone
Ukrainian
Births to Unmarried Women
Births to Unmarried Women Comparison
Immigrants from Sierra Leone
Ukrainians
34.2%
BIRTHS TO UNMARRIED WOMEN
3.1/ 100
METRIC RATING
229th/ 347
METRIC RANK
29.2%
BIRTHS TO UNMARRIED WOMEN
96.3/ 100
METRIC RATING
94th/ 347
METRIC RANK
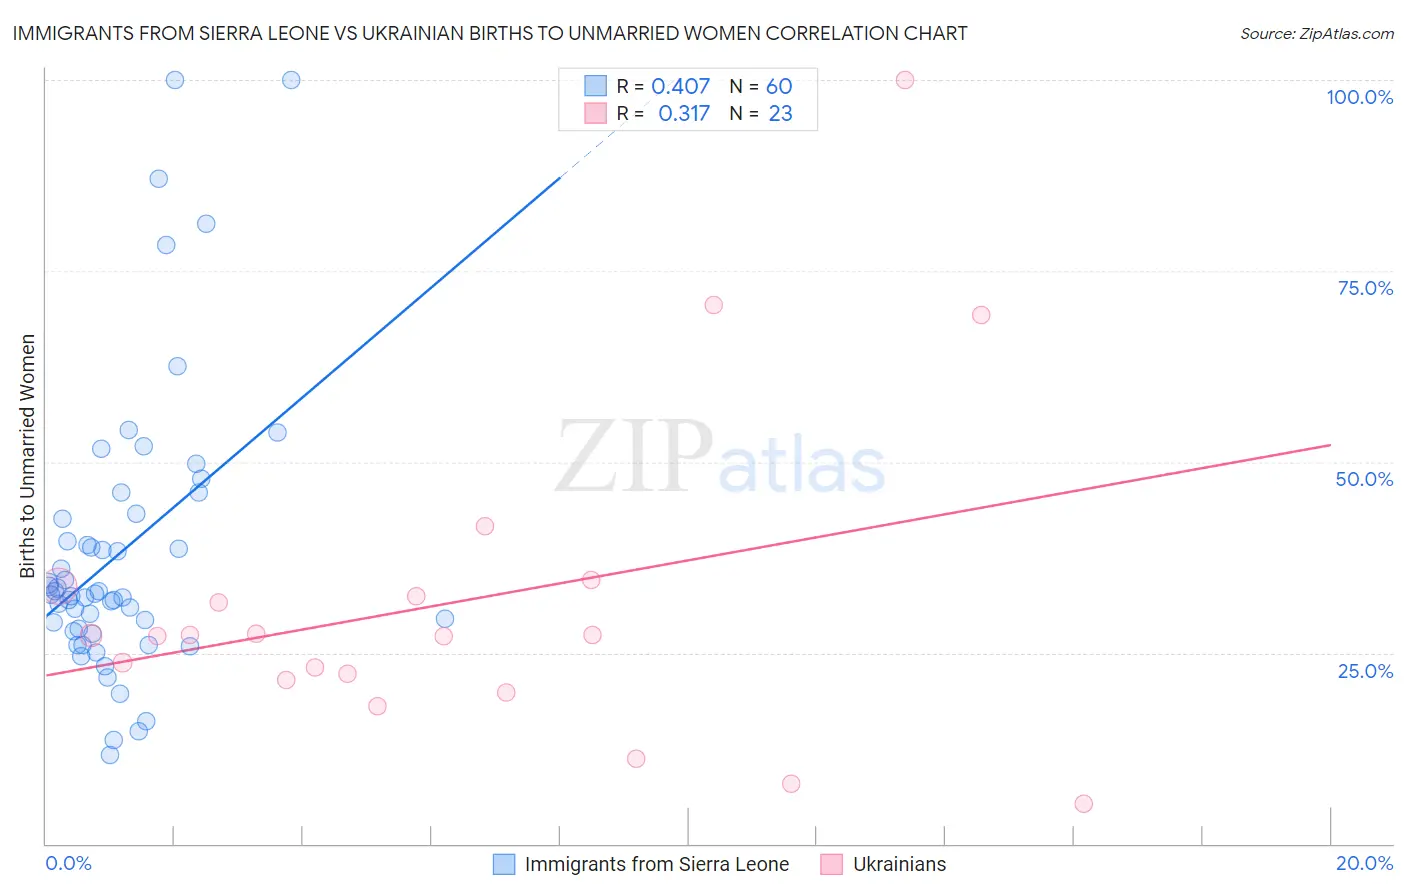
Immigrants from Sierra Leone vs Ukrainian Births to Unmarried Women Correlation Chart
The statistical analysis conducted on geographies consisting of 99,540,756 people shows a moderate positive correlation between the proportion of Immigrants from Sierra Leone and percentage of births to unmarried women in the United States with a correlation coefficient (R) of 0.407 and weighted average of 34.2%. Similarly, the statistical analysis conducted on geographies consisting of 408,725,244 people shows a mild positive correlation between the proportion of Ukrainians and percentage of births to unmarried women in the United States with a correlation coefficient (R) of 0.317 and weighted average of 29.2%, a difference of 17.2%.
Births to Unmarried Women Correlation Summary
| Measurement | Immigrants from Sierra Leone | Ukrainian |
| Minimum | 11.7% | 5.2% |
| Maximum | 100.0% | 100.0% |
| Range | 88.3% | 94.8% |
| Mean | 38.2% | 31.7% |
| Median | 32.6% | 27.3% |
| Interquartile 25% (IQ1) | 28.0% | 21.4% |
| Interquartile 75% (IQ3) | 42.9% | 33.8% |
| Interquartile Range (IQR) | 14.9% | 12.4% |
| Standard Deviation (Sample) | 18.7% | 21.5% |
| Standard Deviation (Population) | 18.6% | 21.0% |
Similar Demographics by Births to Unmarried Women
Demographics Similar to Immigrants from Sierra Leone by Births to Unmarried Women
In terms of births to unmarried women, the demographic groups most similar to Immigrants from Sierra Leone are Ghanaian (34.3%, a difference of 0.020%), Panamanian (34.2%, a difference of 0.11%), Immigrants from Panama (34.2%, a difference of 0.14%), Delaware (34.2%, a difference of 0.16%), and Native Hawaiian (34.3%, a difference of 0.17%).
| Demographics | Rating | Rank | Births to Unmarried Women |
| Immigrants | Uruguay | 4.8 /100 | #222 | Tragic 33.9% |
| Pennsylvania Germans | 4.3 /100 | #223 | Tragic 34.0% |
| Immigrants | Laos | 4.3 /100 | #224 | Tragic 34.0% |
| Spanish | 4.0 /100 | #225 | Tragic 34.1% |
| Delaware | 3.3 /100 | #226 | Tragic 34.2% |
| Immigrants | Panama | 3.3 /100 | #227 | Tragic 34.2% |
| Panamanians | 3.3 /100 | #228 | Tragic 34.2% |
| Immigrants | Sierra Leone | 3.1 /100 | #229 | Tragic 34.2% |
| Ghanaians | 3.1 /100 | #230 | Tragic 34.3% |
| Native Hawaiians | 2.9 /100 | #231 | Tragic 34.3% |
| French Canadians | 2.5 /100 | #232 | Tragic 34.4% |
| Bangladeshis | 2.5 /100 | #233 | Tragic 34.4% |
| Immigrants | Zaire | 2.3 /100 | #234 | Tragic 34.5% |
| Immigrants | Ghana | 2.2 /100 | #235 | Tragic 34.5% |
| Immigrants | Cameroon | 1.6 /100 | #236 | Tragic 34.7% |
Demographics Similar to Ukrainians by Births to Unmarried Women
In terms of births to unmarried women, the demographic groups most similar to Ukrainians are Estonian (29.2%, a difference of 0.12%), Immigrants from Vietnam (29.3%, a difference of 0.13%), Arab (29.2%, a difference of 0.16%), Immigrants from Fiji (29.2%, a difference of 0.20%), and Norwegian (29.3%, a difference of 0.36%).
| Demographics | Rating | Rank | Births to Unmarried Women |
| Taiwanese | 97.3 /100 | #87 | Exceptional 29.0% |
| Immigrants | France | 97.3 /100 | #88 | Exceptional 29.0% |
| Immigrants | Saudi Arabia | 97.0 /100 | #89 | Exceptional 29.1% |
| Immigrants | Latvia | 96.8 /100 | #90 | Exceptional 29.1% |
| Immigrants | Fiji | 96.6 /100 | #91 | Exceptional 29.2% |
| Arabs | 96.5 /100 | #92 | Exceptional 29.2% |
| Estonians | 96.5 /100 | #93 | Exceptional 29.2% |
| Ukrainians | 96.3 /100 | #94 | Exceptional 29.2% |
| Immigrants | Vietnam | 96.1 /100 | #95 | Exceptional 29.3% |
| Norwegians | 95.8 /100 | #96 | Exceptional 29.3% |
| Immigrants | South Africa | 95.7 /100 | #97 | Exceptional 29.3% |
| Immigrants | Syria | 95.7 /100 | #98 | Exceptional 29.4% |
| Immigrants | Denmark | 95.3 /100 | #99 | Exceptional 29.4% |
| Luxembourgers | 95.2 /100 | #100 | Exceptional 29.4% |
| Immigrants | Northern Africa | 94.7 /100 | #101 | Exceptional 29.5% |