Immigrants from Serbia vs Dutch West Indian Family Households with Children

COMPARE

Immigrants from Serbia
Race
Ancestry
AfghanAfricanAlaska NativeAlaskan AthabascanAlbanianAleutAlsatianAmericanApacheArabArapahoArgentineanArmenianAssyrian/Chaldean/SyriacAustralianAustrianBahamianBangladeshiBarbadianBasqueBelgianBelizeanBermudanBhutaneseBlackfeetBolivianBrazilianBritishBritish West IndianBulgarianBurmeseCajunCambodianCanadianCape VerdeanCarpatho RusynCelticCentral AmericanCentral American IndianCherokeeCheyenneChickasawChileanChineseChippewaChoctawColombianColvilleComancheCosta RicanCreeCreekCroatianCrowCubanCypriotCzechCzechoslovakianDanishDelawareDominicanDutchEastern EuropeanEcuadorianEgyptianEnglishEstonianEthiopianEuropeanFijianFilipinoFinnishFrenchFrench American IndianFrench CanadianGermanGerman RussianGhanaianGreekGuamanian/ChamorroGuatemalanGuyaneseHaitianHmongHonduranHopiHoumaHungarianIcelanderIndian (Asian)IndonesianInupiatIranianIraqiIrishIroquoisIsraeliItalianJamaicanJapaneseJordanianKenyanKiowaKoreanLaotianLatvianLebaneseLiberianLithuanianLumbeeLuxembourgerMacedonianMalaysianMalteseMarshalleseMenomineeMexicanMexican American IndianMongolianMoroccanNative HawaiianNavajoNepaleseNew ZealanderNicaraguanNigerianNorthern EuropeanNorwegianOkinawanOsageOttawaPaiutePakistaniPalestinianPanamanianParaguayanPennsylvania GermanPeruvianPimaPolishPortuguesePotawatomiPuebloPuerto RicanPuget Sound SalishRomanianRussianSalvadoranSamoanScandinavianScotch-IrishScottishSeminoleSenegaleseSerbianShoshoneSierra LeoneanSiouxSlavicSlovakSloveneSomaliSouth AfricanSouth AmericanSouth American IndianSoviet UnionSpaniardSpanishSpanish AmericanSpanish American IndianSri LankanSubsaharan AfricanSudaneseSwedishSwissSyrianTaiwaneseThaiTlingit-HaidaTohono O'OdhamTonganTrinidadian and TobagonianTsimshianTurkishU.S. Virgin IslanderUgandanUkrainianUruguayanUteVenezuelanVietnameseWelshWest IndianYakamaYaquiYugoslavianYumanYup'ikZimbabwean
Immigration
NonimmigrantsImmigrantsAfghanistanAfricaAlbaniaArgentinaArmeniaAsiaAustraliaAustriaBahamasBangladeshBarbadosBelarusBelgiumBelizeBoliviaBosnia and HerzegovinaBrazilBulgariaBurma/MyanmarCabo VerdeCambodiaCameroonCanadaCaribbeanCentral AmericaChileChinaColombiaCongoCosta RicaCroatiaCubaCzechoslovakiaDenmarkDominicaDominican RepublicEastern AfricaEastern AsiaEastern EuropeEcuadorEgyptEl SalvadorEnglandEritreaEthiopiaEuropeFijiFranceGermanyGhanaGreeceGrenadaGuatemalaGuyanaHaitiHondurasHong KongHungaryIndiaIndonesiaIranIraqIrelandIsraelItalyJamaicaJapanJordanKazakhstanKenyaKoreaKuwaitLaosLatin AmericaLatviaLebanonLiberiaLithuaniaMalaysiaMexicoMicronesiaMiddle AfricaMoldovaMoroccoNepalNetherlandsNicaraguaNigeriaNorth AmericaNorth MacedoniaNorthern AfricaNorthern EuropeNorwayOceaniaPakistanPanamaPeruPhilippinesPolandPortugalRomaniaRussiaSaudi ArabiaScotlandSenegalSerbiaSierra LeoneSingaporeSomaliaSouth AfricaSouth AmericaSouth Central AsiaSouth Eastern AsiaSouthern EuropeSpainSri LankaSt. Vincent and the GrenadinesSudanSwedenSwitzerlandSyriaTaiwanThailandTrinidad and TobagoTurkeyUgandaUkraineUruguayUzbekistanVenezuelaVietnamWest IndiesWestern AfricaWestern AsiaWestern EuropeYemenZaireZimbabweAzores
Dutch West Indian
Race
Ancestry
AfghanAfricanAlaska NativeAlaskan AthabascanAlbanianAleutAlsatianAmericanApacheArabArapahoArgentineanArmenianAssyrian/Chaldean/SyriacAustralianAustrianBahamianBangladeshiBarbadianBasqueBelgianBelizeanBermudanBhutaneseBlackfeetBolivianBrazilianBritishBritish West IndianBulgarianBurmeseCajunCambodianCanadianCape VerdeanCarpatho RusynCelticCentral AmericanCentral American IndianCherokeeCheyenneChickasawChileanChineseChippewaChoctawColombianColvilleComancheCosta RicanCreeCreekCroatianCrowCubanCypriotCzechCzechoslovakianDanishDelawareDominicanDutchDutch West IndianEastern EuropeanEcuadorianEgyptianEnglishEstonianEthiopianEuropeanFijianFilipinoFinnishFrenchFrench American IndianFrench CanadianGermanGerman RussianGhanaianGreekGuamanian/ChamorroGuatemalanGuyaneseHaitianHmongHonduranHopiHoumaHungarianIcelanderIndian (Asian)IndonesianInupiatIranianIraqiIrishIroquoisIsraeliItalianJamaicanJapaneseJordanianKenyanKiowaKoreanLaotianLatvianLebaneseLiberianLithuanianLumbeeLuxembourgerMacedonianMalaysianMalteseMarshalleseMenomineeMexicanMexican American IndianMongolianMoroccanNative HawaiianNavajoNepaleseNew ZealanderNicaraguanNigerianNorthern EuropeanNorwegianOkinawanOsageOttawaPaiutePakistaniPalestinianPanamanianParaguayanPennsylvania GermanPeruvianPimaPolishPortuguesePotawatomiPuebloPuerto RicanPuget Sound SalishRomanianRussianSalvadoranSamoanScandinavianScotch-IrishScottishSeminoleSenegaleseSerbianShoshoneSierra LeoneanSiouxSlavicSlovakSloveneSomaliSouth AfricanSouth AmericanSouth American IndianSoviet UnionSpaniardSpanishSpanish AmericanSpanish American IndianSri LankanSubsaharan AfricanSudaneseSwedishSwissSyrianTaiwaneseThaiTlingit-HaidaTohono O'OdhamTonganTrinidadian and TobagonianTsimshianTurkishU.S. Virgin IslanderUgandanUkrainianUruguayanUteVenezuelanVietnameseWelshWest IndianYakamaYaquiYugoslavianYumanYup'ikZimbabwean
Immigration
NonimmigrantsImmigrantsAfghanistanAfricaAlbaniaArgentinaArmeniaAsiaAustraliaAustriaBahamasBangladeshBarbadosBelarusBelgiumBelizeBoliviaBosnia and HerzegovinaBrazilBulgariaBurma/MyanmarCabo VerdeCambodiaCameroonCanadaCaribbeanCentral AmericaChileChinaColombiaCongoCosta RicaCroatiaCubaCzechoslovakiaDenmarkDominicaDominican RepublicEastern AfricaEastern AsiaEastern EuropeEcuadorEgyptEl SalvadorEnglandEritreaEthiopiaEuropeFijiFranceGermanyGhanaGreeceGrenadaGuatemalaGuyanaHaitiHondurasHong KongHungaryIndiaIndonesiaIranIraqIrelandIsraelItalyJamaicaJapanJordanKazakhstanKenyaKoreaKuwaitLaosLatin AmericaLatviaLebanonLiberiaLithuaniaMalaysiaMexicoMicronesiaMiddle AfricaMoldovaMoroccoNepalNetherlandsNicaraguaNigeriaNorth AmericaNorth MacedoniaNorthern AfricaNorthern EuropeNorwayOceaniaPakistanPanamaPeruPhilippinesPolandPortugalRomaniaRussiaSaudi ArabiaScotlandSenegalSierra LeoneSingaporeSomaliaSouth AfricaSouth AmericaSouth Central AsiaSouth Eastern AsiaSouthern EuropeSpainSri LankaSt. Vincent and the GrenadinesSudanSwedenSwitzerlandSyriaTaiwanThailandTrinidad and TobagoTurkeyUgandaUkraineUruguayUzbekistanVenezuelaVietnamWest IndiesWestern AfricaWestern AsiaWestern EuropeYemenZaireZimbabweAzores
Family Households with Children
Income
Poverty
Unemployment
Labor Participation
Family Structure
Vehicle Availability
Education Level
Disability

Family Households with Children Comparison

Immigrants from Serbia

Dutch West Indians

Tragic
Poor
25.5%
FAMILY HOUSEHOLDS WITH CHILDREN
0.0/ 100
METRIC RATING
341st/ 347
METRIC RANK
27.2%
FAMILY HOUSEHOLDS WITH CHILDREN
15.8/ 100
METRIC RATING
209th/ 347
METRIC RANK

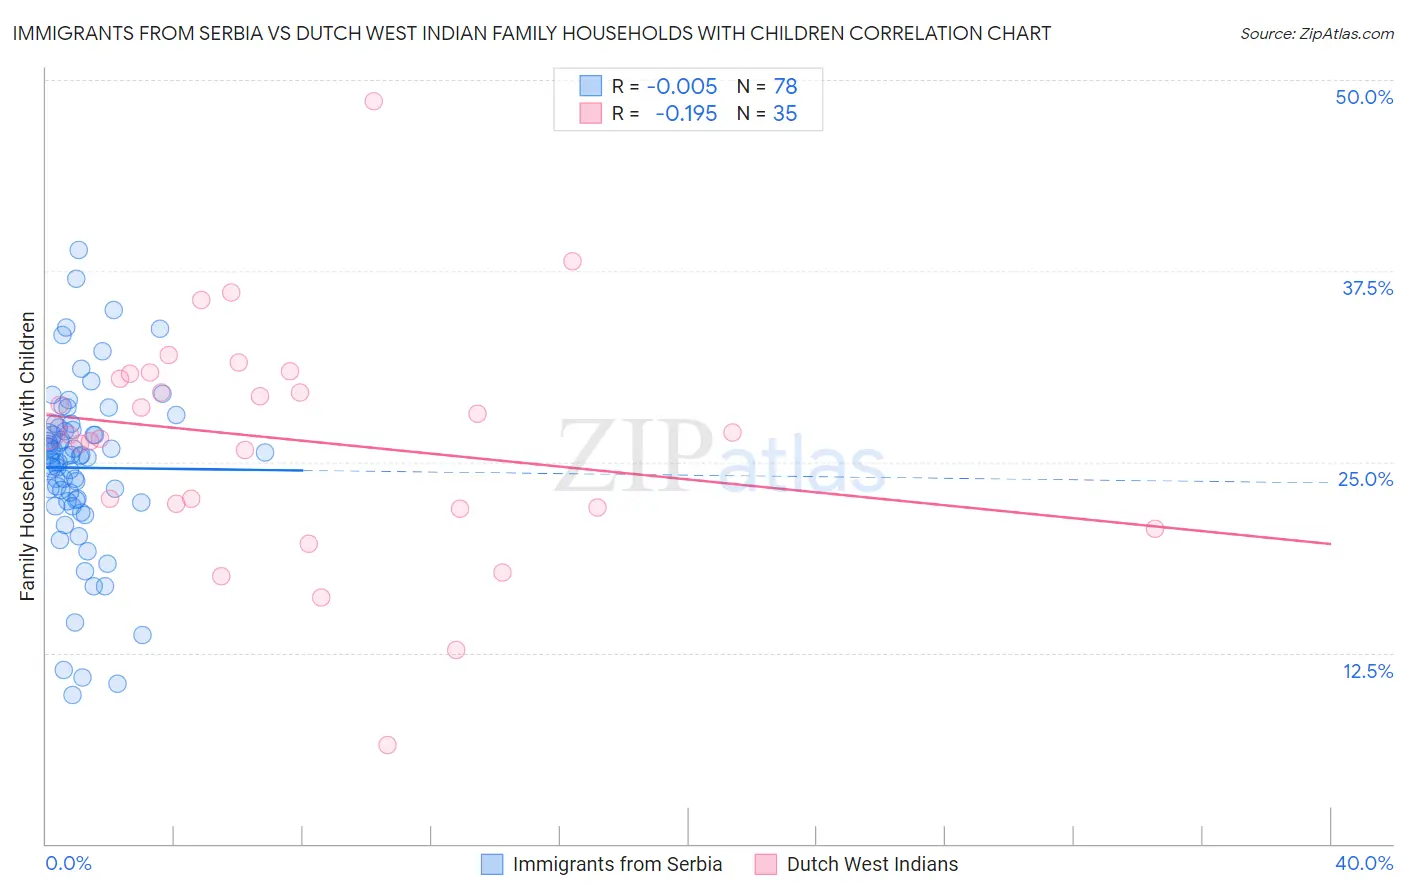
Immigrants from Serbia vs Dutch West Indian Family Households with Children Correlation Chart

The statistical analysis conducted on geographies consisting of 131,676,754 people shows no correlation between the proportion of Immigrants from Serbia and percentage of family households with children in the United States with a correlation coefficient (R) of -0.005 and weighted average of 25.5%. Similarly, the statistical analysis conducted on geographies consisting of 85,765,288 people shows a poor negative correlation between the proportion of Dutch West Indians and percentage of family households with children in the United States with a correlation coefficient (R) of -0.195 and weighted average of 27.2%, a difference of 6.8%.
Immigrants from Serbia vs Dutch West Indian Family Households with Children

Family Households with Children Correlation Summary

MeasurementImmigrants from SerbiaDutch West Indian
Minimum9.7%6.5%
Maximum38.8%48.6%
Range29.1%42.2%
Mean24.6%26.5%
Median25.3%26.9%
Interquartile 25% (IQ1)22.4%22.0%
Interquartile 75% (IQ3)27.1%30.8%
Interquartile Range (IQR)4.7%8.7%
Standard Deviation (Sample)5.6%7.7%
Standard Deviation (Population)5.5%7.5%

Similar Demographics by Family Households with Children

Demographics Similar to Immigrants from Serbia by Family Households with Children

In terms of family households with children, the demographic groups most similar to Immigrants from Serbia are Immigrants from Armenia (25.6%, a difference of 0.38%), Immigrants from St. Vincent and the Grenadines (25.6%, a difference of 0.42%), Arapaho (25.6%, a difference of 0.43%), Puerto Rican (25.6%, a difference of 0.46%), and Alsatian (25.3%, a difference of 0.68%).
DemographicsRating | RankFamily Households with Children
Immigrants | Switzerland
0.0
/100
|
#333
Tragic
25.7%
Slovaks
0.0
/100
|
#334
Tragic
25.7%
Immigrants | Croatia
0.0
/100
|
#335
Tragic
25.7%
Immigrants | West Indies
0.0
/100
|
#336
Tragic
25.7%
Puerto Ricans
0.0
/100
|
#337
Tragic
25.6%
Arapaho
0.0
/100
|
#338
Tragic
25.6%
Immigrants | St. Vincent and the Grenadines
0.0
/100
|
#339
Tragic
25.6%
Immigrants | Armenia
0.0
/100
|
#340
Tragic
25.6%
Immigrants | Serbia
0.0
/100
|
#341
Tragic
25.5%
Alsatians
0.0
/100
|
#342
Tragic
25.3%
Hopi
0.0
/100
|
#343
Tragic
25.2%
Pueblo
0.0
/100
|
#344
Tragic
25.2%
Immigrants | Grenada
0.0
/100
|
#345
Tragic
25.2%
Carpatho Rusyns
0.0
/100
|
#346
Tragic
25.2%
Soviet Union
0.0
/100
|
#347
Tragic
24.8%

Demographics Similar to Dutch West Indians by Family Households with Children

In terms of family households with children, the demographic groups most similar to Dutch West Indians are Immigrants from Poland (27.2%, a difference of 0.030%), Immigrants from Ukraine (27.2%, a difference of 0.060%), Welsh (27.2%, a difference of 0.070%), Immigrants from Dominica (27.2%, a difference of 0.080%), and Okinawan (27.2%, a difference of 0.090%).
DemographicsRating | RankFamily Households with Children
Americans
22.8
/100
|
#202
Fair
27.3%
Kiowa
22.2
/100
|
#203
Fair
27.3%
Immigrants | Sudan
21.6
/100
|
#204
Fair
27.3%
Immigrants | Haiti
20.3
/100
|
#205
Fair
27.2%
Immigrants | Micronesia
20.2
/100
|
#206
Fair
27.2%
Haitians
19.8
/100
|
#207
Poor
27.2%
Immigrants | Poland
16.4
/100
|
#208
Poor
27.2%
Dutch West Indians
15.8
/100
|
#209
Poor
27.2%
Immigrants | Ukraine
14.4
/100
|
#210
Poor
27.2%
Welsh
14.2
/100
|
#211
Poor
27.2%
Immigrants | Dominica
13.9
/100
|
#212
Poor
27.2%
Okinawans
13.7
/100
|
#213
Poor
27.2%
Africans
13.0
/100
|
#214
Poor
27.2%
Northern Europeans
12.8
/100
|
#215
Poor
27.2%
Cubans
12.2
/100
|
#216
Poor
27.1%