Immigrants from Serbia vs Chilean Divorced or Separated
COMPARE
Immigrants from Serbia
Chilean
Divorced or Separated
Divorced or Separated Comparison
Immigrants from Serbia
Chileans
11.6%
DIVORCED OR SEPARATED
98.8/ 100
METRIC RATING
95th/ 347
METRIC RANK
12.0%
DIVORCED OR SEPARATED
71.3/ 100
METRIC RATING
154th/ 347
METRIC RANK
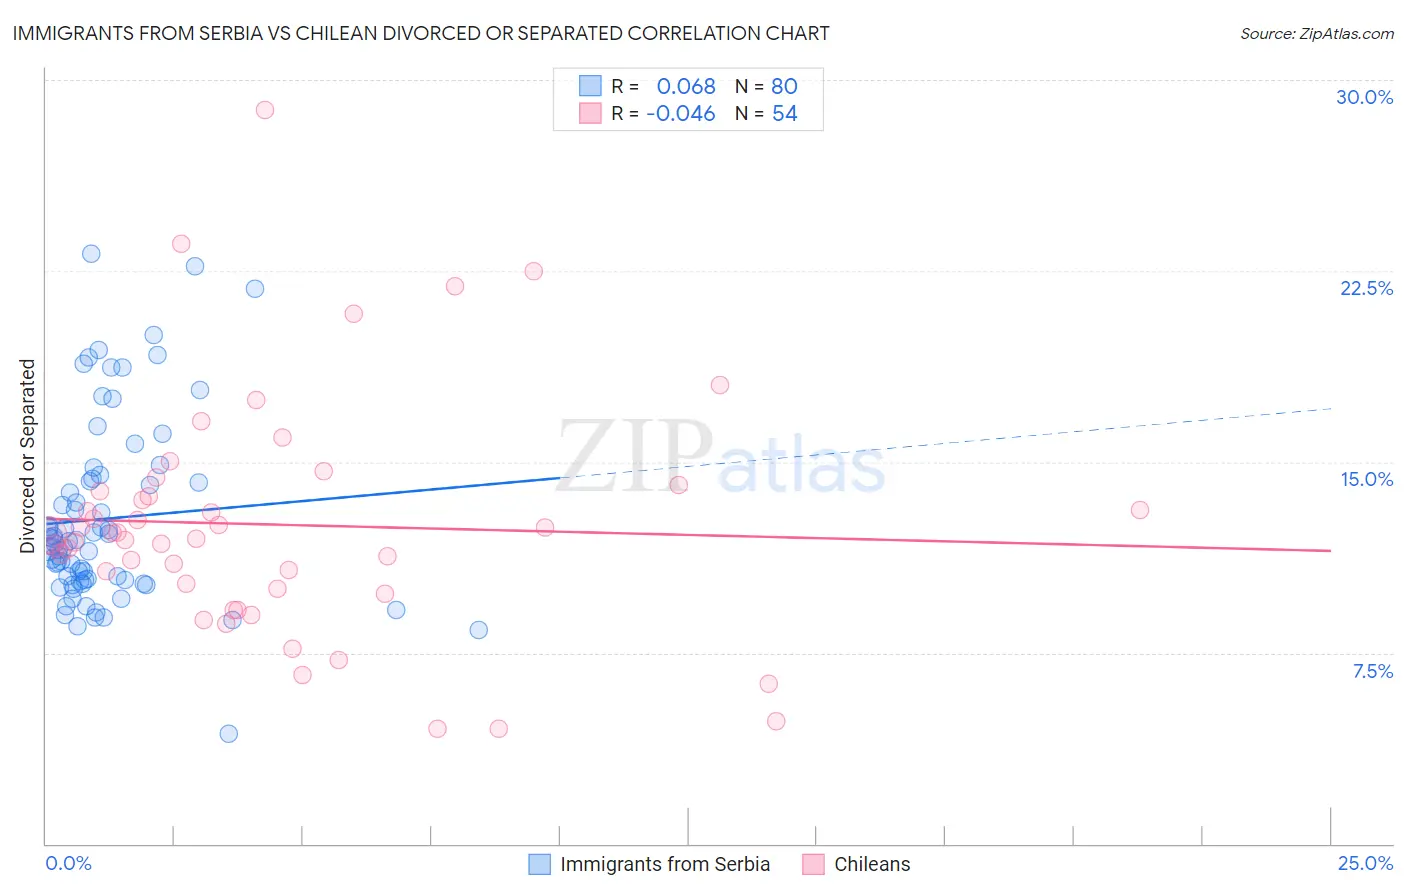
Immigrants from Serbia vs Chilean Divorced or Separated Correlation Chart
The statistical analysis conducted on geographies consisting of 131,725,275 people shows a slight positive correlation between the proportion of Immigrants from Serbia and percentage of population currently divorced or separated in the United States with a correlation coefficient (R) of 0.068 and weighted average of 11.6%. Similarly, the statistical analysis conducted on geographies consisting of 256,589,464 people shows no correlation between the proportion of Chileans and percentage of population currently divorced or separated in the United States with a correlation coefficient (R) of -0.046 and weighted average of 12.0%, a difference of 3.1%.
Divorced or Separated Correlation Summary
| Measurement | Immigrants from Serbia | Chilean |
| Minimum | 4.3% | 4.5% |
| Maximum | 23.2% | 28.8% |
| Range | 18.9% | 24.3% |
| Mean | 12.8% | 12.5% |
| Median | 11.8% | 12.0% |
| Interquartile 25% (IQ1) | 10.3% | 10.0% |
| Interquartile 75% (IQ3) | 14.3% | 13.9% |
| Interquartile Range (IQR) | 4.0% | 3.9% |
| Standard Deviation (Sample) | 3.7% | 4.7% |
| Standard Deviation (Population) | 3.6% | 4.6% |
Similar Demographics by Divorced or Separated
Demographics Similar to Immigrants from Serbia by Divorced or Separated
In terms of divorced or separated, the demographic groups most similar to Immigrants from Serbia are Immigrants from Ukraine (11.6%, a difference of 0.020%), Latvian (11.6%, a difference of 0.050%), Immigrants from Jordan (11.6%, a difference of 0.090%), Immigrants from Fiji (11.6%, a difference of 0.10%), and Immigrants from Sweden (11.6%, a difference of 0.10%).
| Demographics | Rating | Rank | Divorced or Separated |
| Immigrants | Europe | 99.2 /100 | #88 | Exceptional 11.6% |
| Immigrants | Southern Europe | 99.1 /100 | #89 | Exceptional 11.6% |
| Zimbabweans | 99.0 /100 | #90 | Exceptional 11.6% |
| Spanish American Indians | 99.0 /100 | #91 | Exceptional 11.6% |
| Immigrants | Denmark | 98.9 /100 | #92 | Exceptional 11.6% |
| Arabs | 98.9 /100 | #93 | Exceptional 11.6% |
| Immigrants | Fiji | 98.9 /100 | #94 | Exceptional 11.6% |
| Immigrants | Serbia | 98.8 /100 | #95 | Exceptional 11.6% |
| Immigrants | Ukraine | 98.7 /100 | #96 | Exceptional 11.6% |
| Latvians | 98.7 /100 | #97 | Exceptional 11.6% |
| Immigrants | Jordan | 98.6 /100 | #98 | Exceptional 11.6% |
| Immigrants | Sweden | 98.6 /100 | #99 | Exceptional 11.6% |
| Immigrants | Northern Europe | 98.6 /100 | #100 | Exceptional 11.6% |
| Immigrants | Guyana | 98.5 /100 | #101 | Exceptional 11.6% |
| Immigrants | Croatia | 98.3 /100 | #102 | Exceptional 11.6% |
Demographics Similar to Chileans by Divorced or Separated
In terms of divorced or separated, the demographic groups most similar to Chileans are Japanese (12.0%, a difference of 0.020%), Austrian (12.0%, a difference of 0.040%), Hungarian (12.0%, a difference of 0.040%), Immigrants from Hungary (11.9%, a difference of 0.10%), and Immigrants from Brazil (12.0%, a difference of 0.10%).
| Demographics | Rating | Rank | Divorced or Separated |
| Poles | 78.6 /100 | #147 | Good 11.9% |
| Italians | 77.8 /100 | #148 | Good 11.9% |
| Immigrants | Oceania | 77.7 /100 | #149 | Good 11.9% |
| Immigrants | Portugal | 77.3 /100 | #150 | Good 11.9% |
| Czechs | 76.4 /100 | #151 | Good 11.9% |
| Immigrants | Hungary | 73.7 /100 | #152 | Good 11.9% |
| Austrians | 72.2 /100 | #153 | Good 12.0% |
| Chileans | 71.3 /100 | #154 | Good 12.0% |
| Japanese | 70.9 /100 | #155 | Good 12.0% |
| Hungarians | 70.3 /100 | #156 | Good 12.0% |
| Immigrants | Brazil | 68.8 /100 | #157 | Good 12.0% |
| Icelanders | 66.0 /100 | #158 | Good 12.0% |
| Immigrants | Barbados | 66.0 /100 | #159 | Good 12.0% |
| Immigrants | Scotland | 65.8 /100 | #160 | Good 12.0% |
| Marshallese | 64.6 /100 | #161 | Good 12.0% |