Immigrants from Russia vs Immigrants from Australia Family Households with Children

COMPARE

Immigrants from Russia
Race
Ancestry
AfghanAfricanAlaska NativeAlaskan AthabascanAlbanianAleutAlsatianAmericanApacheArabArapahoArgentineanArmenianAssyrian/Chaldean/SyriacAustralianAustrianBahamianBangladeshiBarbadianBasqueBelgianBelizeanBermudanBhutaneseBlackfeetBolivianBrazilianBritishBritish West IndianBulgarianBurmeseCajunCambodianCanadianCape VerdeanCarpatho RusynCelticCentral AmericanCentral American IndianCherokeeCheyenneChickasawChileanChineseChippewaChoctawColombianColvilleComancheCosta RicanCreeCreekCroatianCrowCubanCypriotCzechCzechoslovakianDanishDelawareDominicanDutchDutch West IndianEastern EuropeanEcuadorianEgyptianEnglishEstonianEthiopianEuropeanFijianFilipinoFinnishFrenchFrench American IndianFrench CanadianGermanGerman RussianGhanaianGreekGuamanian/ChamorroGuatemalanGuyaneseHaitianHmongHonduranHopiHoumaHungarianIcelanderIndian (Asian)IndonesianInupiatIranianIraqiIrishIroquoisIsraeliItalianJamaicanJapaneseJordanianKenyanKiowaKoreanLaotianLatvianLebaneseLiberianLithuanianLumbeeLuxembourgerMacedonianMalaysianMalteseMarshalleseMenomineeMexicanMexican American IndianMongolianMoroccanNative HawaiianNavajoNepaleseNew ZealanderNicaraguanNigerianNorthern EuropeanNorwegianOkinawanOsageOttawaPaiutePakistaniPalestinianPanamanianParaguayanPennsylvania GermanPeruvianPimaPolishPortuguesePotawatomiPuebloPuerto RicanPuget Sound SalishRomanianRussianSalvadoranSamoanScandinavianScotch-IrishScottishSeminoleSenegaleseSerbianShoshoneSierra LeoneanSiouxSlavicSlovakSloveneSomaliSouth AfricanSouth AmericanSouth American IndianSoviet UnionSpaniardSpanishSpanish AmericanSpanish American IndianSri LankanSubsaharan AfricanSudaneseSwedishSwissSyrianTaiwaneseThaiTlingit-HaidaTohono O'OdhamTonganTrinidadian and TobagonianTsimshianTurkishU.S. Virgin IslanderUgandanUkrainianUruguayanUteVenezuelanVietnameseWelshWest IndianYakamaYaquiYugoslavianYumanYup'ikZimbabwean
Immigration
NonimmigrantsImmigrantsAfghanistanAfricaAlbaniaArgentinaArmeniaAsiaAustriaBahamasBangladeshBarbadosBelarusBelgiumBelizeBoliviaBosnia and HerzegovinaBrazilBulgariaBurma/MyanmarCabo VerdeCambodiaCameroonCanadaCaribbeanCentral AmericaChileChinaColombiaCongoCosta RicaCroatiaCubaCzechoslovakiaDenmarkDominicaDominican RepublicEastern AfricaEastern AsiaEastern EuropeEcuadorEgyptEl SalvadorEnglandEritreaEthiopiaEuropeFijiFranceGermanyGhanaGreeceGrenadaGuatemalaGuyanaHaitiHondurasHong KongHungaryIndiaIndonesiaIranIraqIrelandIsraelItalyJamaicaJapanJordanKazakhstanKenyaKoreaKuwaitLaosLatin AmericaLatviaLebanonLiberiaLithuaniaMalaysiaMexicoMicronesiaMiddle AfricaMoldovaMoroccoNepalNetherlandsNicaraguaNigeriaNorth AmericaNorth MacedoniaNorthern AfricaNorthern EuropeNorwayOceaniaPakistanPanamaPeruPhilippinesPolandPortugalRomaniaRussiaSaudi ArabiaScotlandSenegalSerbiaSierra LeoneSingaporeSomaliaSouth AfricaSouth AmericaSouth Central AsiaSouth Eastern AsiaSouthern EuropeSpainSri LankaSt. Vincent and the GrenadinesSudanSwedenSwitzerlandSyriaTaiwanThailandTrinidad and TobagoTurkeyUgandaUkraineUruguayUzbekistanVenezuelaVietnamWest IndiesWestern AfricaWestern AsiaWestern EuropeYemenZaireZimbabweAzores
Immigrants from Australia
Race
Ancestry
AfghanAfricanAlaska NativeAlaskan AthabascanAlbanianAleutAlsatianAmericanApacheArabArapahoArgentineanArmenianAssyrian/Chaldean/SyriacAustralianAustrianBahamianBangladeshiBarbadianBasqueBelgianBelizeanBermudanBhutaneseBlackfeetBolivianBrazilianBritishBritish West IndianBulgarianBurmeseCajunCambodianCanadianCape VerdeanCarpatho RusynCelticCentral AmericanCentral American IndianCherokeeCheyenneChickasawChileanChineseChippewaChoctawColombianColvilleComancheCosta RicanCreeCreekCroatianCrowCubanCypriotCzechCzechoslovakianDanishDelawareDominicanDutchDutch West IndianEastern EuropeanEcuadorianEgyptianEnglishEstonianEthiopianEuropeanFijianFilipinoFinnishFrenchFrench American IndianFrench CanadianGermanGerman RussianGhanaianGreekGuamanian/ChamorroGuatemalanGuyaneseHaitianHmongHonduranHopiHoumaHungarianIcelanderIndian (Asian)IndonesianInupiatIranianIraqiIrishIroquoisIsraeliItalianJamaicanJapaneseJordanianKenyanKiowaKoreanLaotianLatvianLebaneseLiberianLithuanianLumbeeLuxembourgerMacedonianMalaysianMalteseMarshalleseMenomineeMexicanMexican American IndianMongolianMoroccanNative HawaiianNavajoNepaleseNew ZealanderNicaraguanNigerianNorthern EuropeanNorwegianOkinawanOsageOttawaPaiutePakistaniPalestinianPanamanianParaguayanPennsylvania GermanPeruvianPimaPolishPortuguesePotawatomiPuebloPuerto RicanPuget Sound SalishRomanianRussianSalvadoranSamoanScandinavianScotch-IrishScottishSeminoleSenegaleseSerbianShoshoneSierra LeoneanSiouxSlavicSlovakSloveneSomaliSouth AfricanSouth AmericanSouth American IndianSoviet UnionSpaniardSpanishSpanish AmericanSpanish American IndianSri LankanSubsaharan AfricanSudaneseSwedishSwissSyrianTaiwaneseThaiTlingit-HaidaTohono O'OdhamTonganTrinidadian and TobagonianTsimshianTurkishU.S. Virgin IslanderUgandanUkrainianUruguayanUteVenezuelanVietnameseWelshWest IndianYakamaYaquiYugoslavianYumanYup'ikZimbabwean
Immigration
NonimmigrantsImmigrantsAfghanistanAfricaAlbaniaArgentinaArmeniaAsiaAustraliaAustriaBahamasBangladeshBarbadosBelarusBelgiumBelizeBoliviaBosnia and HerzegovinaBrazilBulgariaBurma/MyanmarCabo VerdeCambodiaCameroonCanadaCaribbeanCentral AmericaChileChinaColombiaCongoCosta RicaCroatiaCubaCzechoslovakiaDenmarkDominicaDominican RepublicEastern AfricaEastern AsiaEastern EuropeEcuadorEgyptEl SalvadorEnglandEritreaEthiopiaEuropeFijiFranceGermanyGhanaGreeceGrenadaGuatemalaGuyanaHaitiHondurasHong KongHungaryIndiaIndonesiaIranIraqIrelandIsraelItalyJamaicaJapanJordanKazakhstanKenyaKoreaKuwaitLaosLatin AmericaLatviaLebanonLiberiaLithuaniaMalaysiaMexicoMicronesiaMiddle AfricaMoldovaMoroccoNepalNetherlandsNicaraguaNigeriaNorth AmericaNorth MacedoniaNorthern AfricaNorthern EuropeNorwayOceaniaPakistanPanamaPeruPhilippinesPolandPortugalRomaniaSaudi ArabiaScotlandSenegalSerbiaSierra LeoneSingaporeSomaliaSouth AfricaSouth AmericaSouth Central AsiaSouth Eastern AsiaSouthern EuropeSpainSri LankaSt. Vincent and the GrenadinesSudanSwedenSwitzerlandSyriaTaiwanThailandTrinidad and TobagoTurkeyUgandaUkraineUruguayUzbekistanVenezuelaVietnamWest IndiesWestern AfricaWestern AsiaWestern EuropeYemenZaireZimbabweAzores
Family Households with Children
Income
Poverty
Unemployment
Labor Participation
Family Structure
Vehicle Availability
Education Level
Disability

Family Households with Children Comparison

Immigrants from Russia

Immigrants from Australia

Tragic
Tragic
26.8%
FAMILY HOUSEHOLDS WITH CHILDREN
1.0/ 100
METRIC RATING
262nd/ 347
METRIC RANK
26.0%
FAMILY HOUSEHOLDS WITH CHILDREN
0.0/ 100
METRIC RATING
323rd/ 347
METRIC RANK

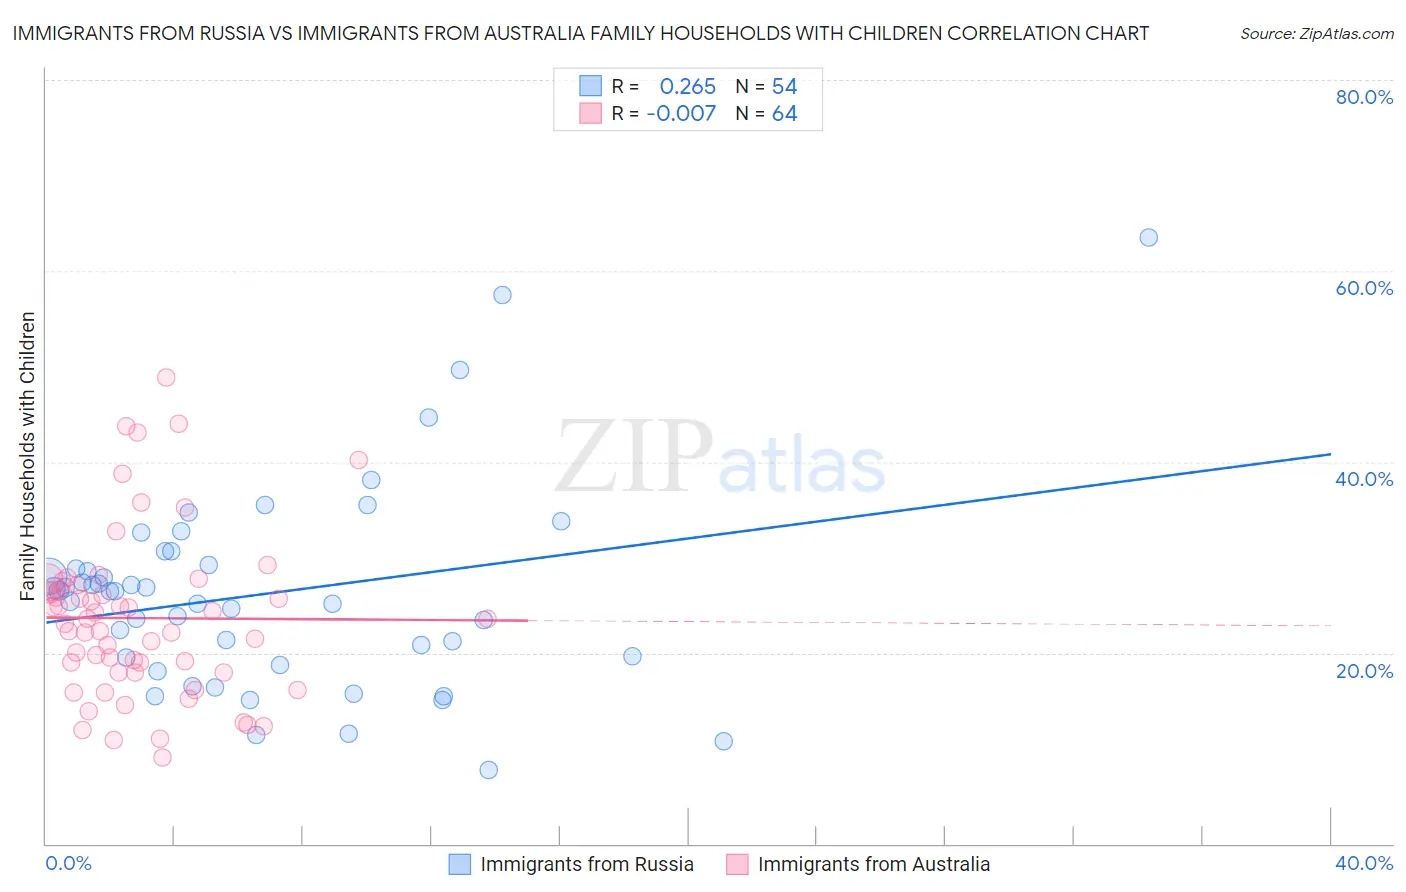
Immigrants from Russia vs Immigrants from Australia Family Households with Children Correlation Chart

The statistical analysis conducted on geographies consisting of 347,605,681 people shows a weak positive correlation between the proportion of Immigrants from Russia and percentage of family households with children in the United States with a correlation coefficient (R) of 0.265 and weighted average of 26.8%. Similarly, the statistical analysis conducted on geographies consisting of 227,064,474 people shows no correlation between the proportion of Immigrants from Australia and percentage of family households with children in the United States with a correlation coefficient (R) of -0.007 and weighted average of 26.0%, a difference of 2.8%.
Immigrants from Russia vs Immigrants from Australia Family Households with Children

Family Households with Children Correlation Summary

MeasurementImmigrants from RussiaImmigrants from Australia
Minimum7.7%9.0%
Maximum63.5%48.8%
Range55.8%39.8%
Mean26.2%23.6%
Median26.4%23.3%
Interquartile 25% (IQ1)19.4%18.0%
Interquartile 75% (IQ3)29.2%26.9%
Interquartile Range (IQR)9.7%8.9%
Standard Deviation (Sample)10.6%8.6%
Standard Deviation (Population)10.5%8.5%

Similar Demographics by Family Households with Children

Demographics Similar to Immigrants from Russia by Family Households with Children

In terms of family households with children, the demographic groups most similar to Immigrants from Russia are Immigrants from North Macedonia (26.7%, a difference of 0.0%), Taiwanese (26.7%, a difference of 0.040%), Chippewa (26.7%, a difference of 0.040%), Maltese (26.7%, a difference of 0.050%), and Immigrants from Uzbekistan (26.7%, a difference of 0.050%).
DemographicsRating | RankFamily Households with Children
German Russians
1.5
/100
|
#255
Tragic
26.8%
Scotch-Irish
1.4
/100
|
#256
Tragic
26.8%
Slavs
1.3
/100
|
#257
Tragic
26.8%
Immigrants | Cuba
1.3
/100
|
#258
Tragic
26.8%
Immigrants | Lithuania
1.2
/100
|
#259
Tragic
26.8%
Immigrants | Jamaica
1.2
/100
|
#260
Tragic
26.8%
Immigrants | Belarus
1.1
/100
|
#261
Tragic
26.8%
Immigrants | Russia
1.0
/100
|
#262
Tragic
26.8%
Immigrants | North Macedonia
1.0
/100
|
#263
Tragic
26.7%
Taiwanese
0.9
/100
|
#264
Tragic
26.7%
Chippewa
0.9
/100
|
#265
Tragic
26.7%
Maltese
0.9
/100
|
#266
Tragic
26.7%
Immigrants | Uzbekistan
0.9
/100
|
#267
Tragic
26.7%
Immigrants | Belgium
0.9
/100
|
#268
Tragic
26.7%
Immigrants | Denmark
0.8
/100
|
#269
Tragic
26.7%

Demographics Similar to Immigrants from Australia by Family Households with Children

In terms of family households with children, the demographic groups most similar to Immigrants from Australia are Immigrants from Greece (26.0%, a difference of 0.030%), Chinese (26.0%, a difference of 0.030%), British West Indian (26.0%, a difference of 0.040%), Tlingit-Haida (26.0%, a difference of 0.060%), and Immigrants from France (26.0%, a difference of 0.070%).
DemographicsRating | RankFamily Households with Children
Estonians
0.0
/100
|
#316
Tragic
26.1%
Ottawa
0.0
/100
|
#317
Tragic
26.1%
Iroquois
0.0
/100
|
#318
Tragic
26.1%
Immigrants | France
0.0
/100
|
#319
Tragic
26.0%
Tlingit-Haida
0.0
/100
|
#320
Tragic
26.0%
British West Indians
0.0
/100
|
#321
Tragic
26.0%
Immigrants | Greece
0.0
/100
|
#322
Tragic
26.0%
Immigrants | Australia
0.0
/100
|
#323
Tragic
26.0%
Chinese
0.0
/100
|
#324
Tragic
26.0%
Barbadians
0.0
/100
|
#325
Tragic
26.0%
Immigrants | Ireland
0.0
/100
|
#326
Tragic
26.0%
Immigrants | Barbados
0.0
/100
|
#327
Tragic
26.0%
Immigrants | Albania
0.0
/100
|
#328
Tragic
25.9%
Cypriots
0.0
/100
|
#329
Tragic
25.9%
Immigrants | Latvia
0.0
/100
|
#330
Tragic
25.9%