Immigrants from Poland vs Yugoslavian Family Households with Children
COMPARE
Immigrants from Poland
Yugoslavian
Family Households with Children
Family Households with Children Comparison
Immigrants from Poland
Yugoslavians
27.2%
FAMILY HOUSEHOLDS WITH CHILDREN
16.4/ 100
METRIC RATING
208th/ 347
METRIC RANK
27.0%
FAMILY HOUSEHOLDS WITH CHILDREN
5.1/ 100
METRIC RATING
232nd/ 347
METRIC RANK
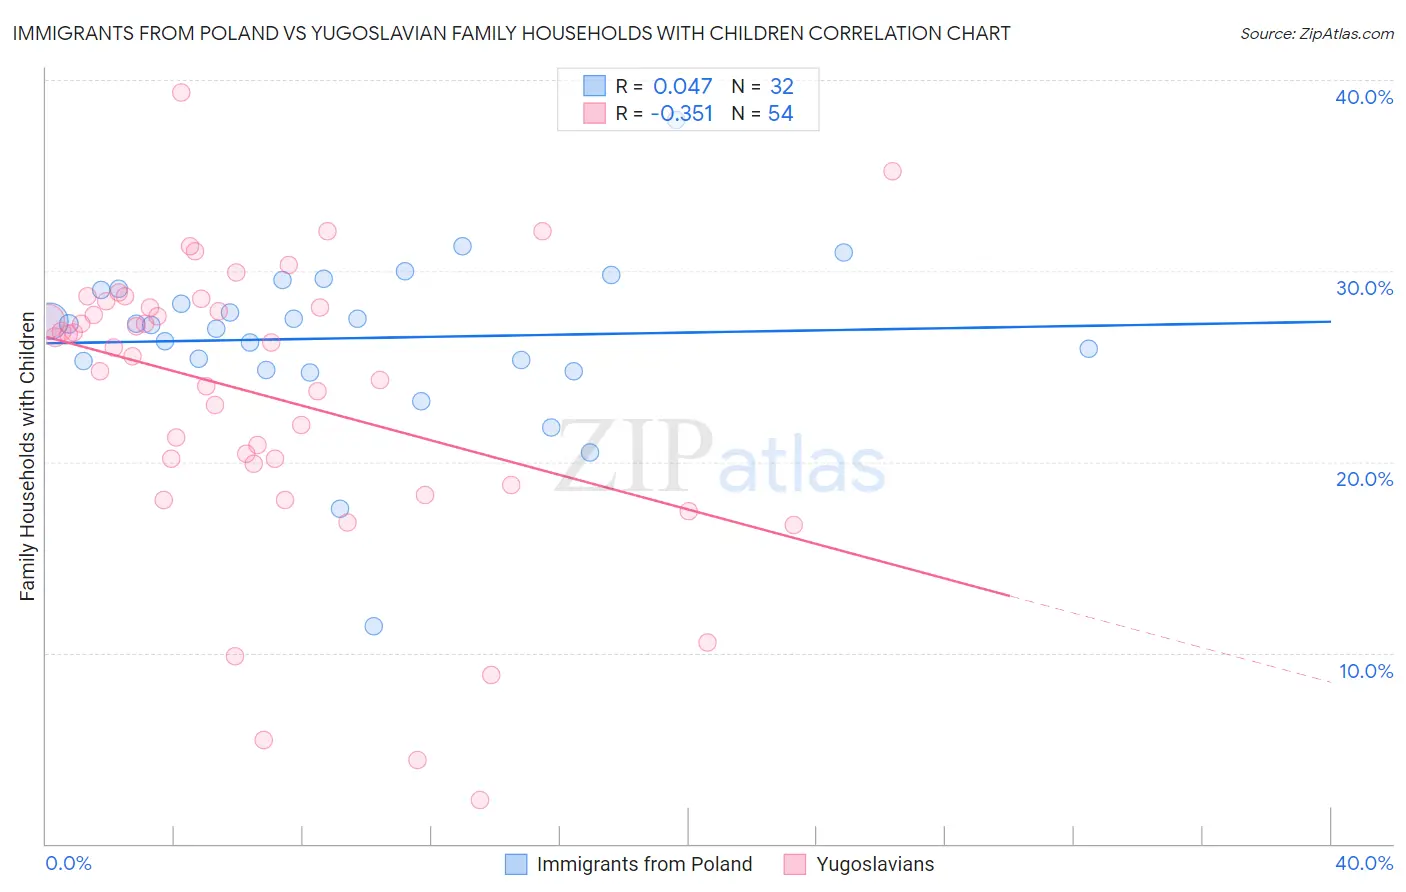
Immigrants from Poland vs Yugoslavian Family Households with Children Correlation Chart
The statistical analysis conducted on geographies consisting of 304,692,657 people shows no correlation between the proportion of Immigrants from Poland and percentage of family households with children in the United States with a correlation coefficient (R) of 0.047 and weighted average of 27.2%. Similarly, the statistical analysis conducted on geographies consisting of 285,532,788 people shows a mild negative correlation between the proportion of Yugoslavians and percentage of family households with children in the United States with a correlation coefficient (R) of -0.351 and weighted average of 27.0%, a difference of 0.73%.
Family Households with Children Correlation Summary
| Measurement | Immigrants from Poland | Yugoslavian |
| Minimum | 11.4% | 2.3% |
| Maximum | 37.9% | 39.4% |
| Range | 26.5% | 37.1% |
| Mean | 26.5% | 23.5% |
| Median | 27.2% | 26.1% |
| Interquartile 25% (IQ1) | 25.0% | 19.9% |
| Interquartile 75% (IQ3) | 29.0% | 28.1% |
| Interquartile Range (IQR) | 4.0% | 8.2% |
| Standard Deviation (Sample) | 4.5% | 7.6% |
| Standard Deviation (Population) | 4.4% | 7.6% |
Similar Demographics by Family Households with Children
Demographics Similar to Immigrants from Poland by Family Households with Children
In terms of family households with children, the demographic groups most similar to Immigrants from Poland are Dutch West Indian (27.2%, a difference of 0.030%), Immigrants from Ukraine (27.2%, a difference of 0.090%), Welsh (27.2%, a difference of 0.10%), Immigrants from Dominica (27.2%, a difference of 0.11%), and Okinawan (27.2%, a difference of 0.12%).
| Demographics | Rating | Rank | Family Households with Children |
| Bhutanese | 25.1 /100 | #201 | Fair 27.3% |
| Americans | 22.8 /100 | #202 | Fair 27.3% |
| Kiowa | 22.2 /100 | #203 | Fair 27.3% |
| Immigrants | Sudan | 21.6 /100 | #204 | Fair 27.3% |
| Immigrants | Haiti | 20.3 /100 | #205 | Fair 27.2% |
| Immigrants | Micronesia | 20.2 /100 | #206 | Fair 27.2% |
| Haitians | 19.8 /100 | #207 | Poor 27.2% |
| Immigrants | Poland | 16.4 /100 | #208 | Poor 27.2% |
| Dutch West Indians | 15.8 /100 | #209 | Poor 27.2% |
| Immigrants | Ukraine | 14.4 /100 | #210 | Poor 27.2% |
| Welsh | 14.2 /100 | #211 | Poor 27.2% |
| Immigrants | Dominica | 13.9 /100 | #212 | Poor 27.2% |
| Okinawans | 13.7 /100 | #213 | Poor 27.2% |
| Africans | 13.0 /100 | #214 | Poor 27.2% |
| Northern Europeans | 12.8 /100 | #215 | Poor 27.2% |
Demographics Similar to Yugoslavians by Family Households with Children
In terms of family households with children, the demographic groups most similar to Yugoslavians are Immigrants from Italy (27.0%, a difference of 0.0%), Luxembourger (27.0%, a difference of 0.050%), Bulgarian (27.0%, a difference of 0.070%), Immigrants from Germany (27.0%, a difference of 0.080%), and Immigrants from Morocco (27.0%, a difference of 0.12%).
| Demographics | Rating | Rank | Family Households with Children |
| Canadians | 7.5 /100 | #225 | Tragic 27.1% |
| Czechoslovakians | 6.6 /100 | #226 | Tragic 27.0% |
| Tsimshian | 6.6 /100 | #227 | Tragic 27.0% |
| Scottish | 6.5 /100 | #228 | Tragic 27.0% |
| Immigrants | Caribbean | 6.3 /100 | #229 | Tragic 27.0% |
| Bulgarians | 5.8 /100 | #230 | Tragic 27.0% |
| Luxembourgers | 5.5 /100 | #231 | Tragic 27.0% |
| Yugoslavians | 5.1 /100 | #232 | Tragic 27.0% |
| Immigrants | Italy | 5.0 /100 | #233 | Tragic 27.0% |
| Immigrants | Germany | 4.4 /100 | #234 | Tragic 27.0% |
| Immigrants | Morocco | 4.2 /100 | #235 | Tragic 27.0% |
| Cape Verdeans | 3.6 /100 | #236 | Tragic 26.9% |
| Immigrants | Netherlands | 3.5 /100 | #237 | Tragic 26.9% |
| Moroccans | 3.4 /100 | #238 | Tragic 26.9% |
| Immigrants | Southern Europe | 3.4 /100 | #239 | Tragic 26.9% |