Immigrants from Pakistan vs Immigrants from Uzbekistan Average Family Size
COMPARE
Immigrants from Pakistan
Immigrants from Uzbekistan
Average Family Size
Average Family Size Comparison
Immigrants from Pakistan
Immigrants from Uzbekistan
3.30
AVERAGE FAMILY SIZE
99.2/ 100
METRIC RATING
91st/ 347
METRIC RANK
3.24
AVERAGE FAMILY SIZE
67.0/ 100
METRIC RATING
157th/ 347
METRIC RANK
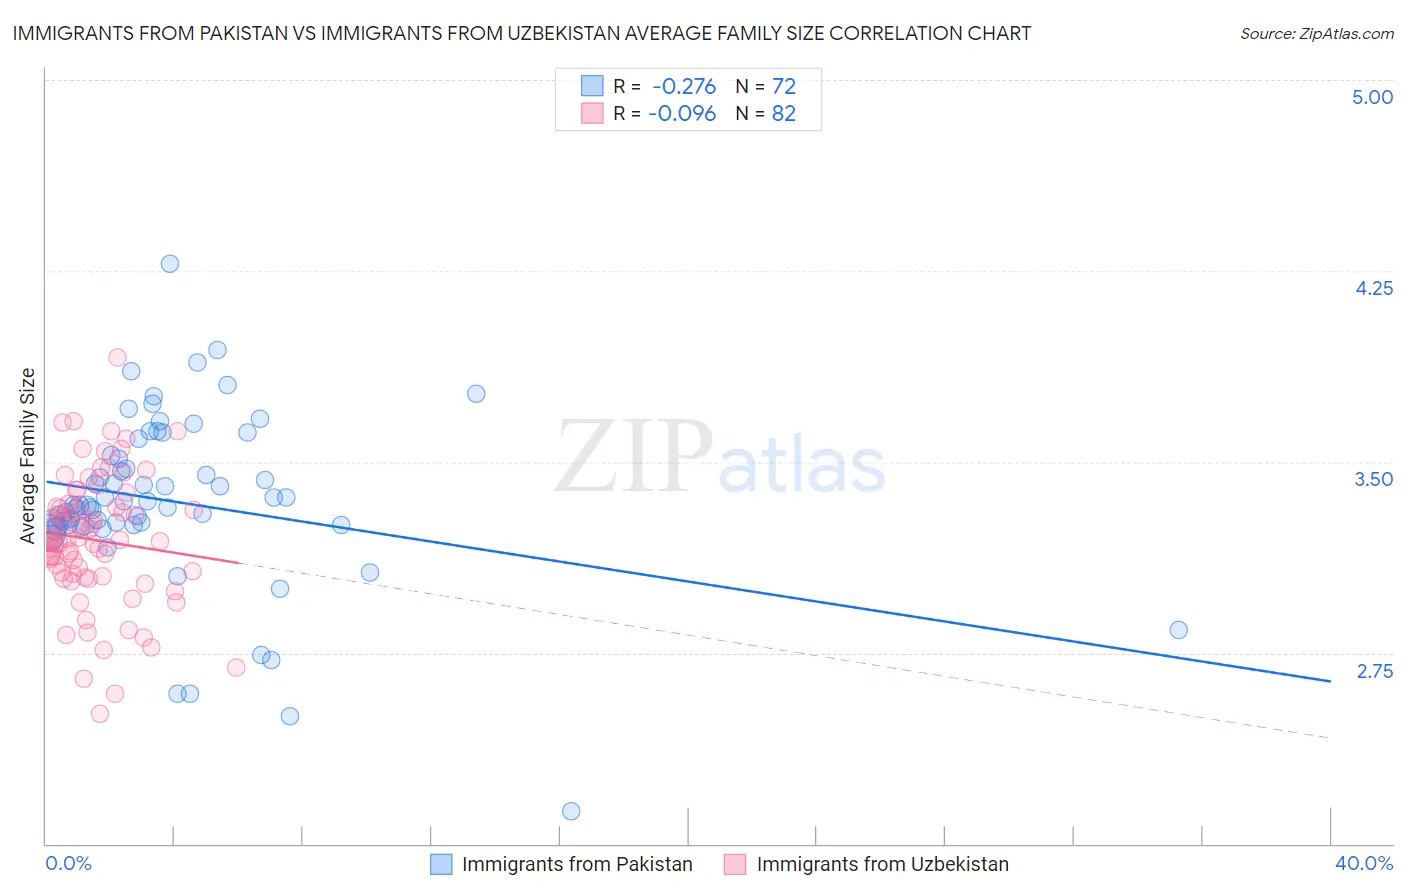
Immigrants from Pakistan vs Immigrants from Uzbekistan Average Family Size Correlation Chart
The statistical analysis conducted on geographies consisting of 283,802,176 people shows a weak negative correlation between the proportion of Immigrants from Pakistan and average family size in the United States with a correlation coefficient (R) of -0.276 and weighted average of 3.30. Similarly, the statistical analysis conducted on geographies consisting of 118,722,943 people shows a slight negative correlation between the proportion of Immigrants from Uzbekistan and average family size in the United States with a correlation coefficient (R) of -0.096 and weighted average of 3.24, a difference of 1.9%.
Average Family Size Correlation Summary
| Measurement | Immigrants from Pakistan | Immigrants from Uzbekistan |
| Minimum | 2.13 | 2.51 |
| Maximum | 4.28 | 3.91 |
| Range | 2.15 | 1.40 |
| Mean | 3.34 | 3.19 |
| Median | 3.33 | 3.19 |
| Interquartile 25% (IQ1) | 3.25 | 3.05 |
| Interquartile 75% (IQ3) | 3.52 | 3.32 |
| Interquartile Range (IQR) | 0.27 | 0.27 |
| Standard Deviation (Sample) | 0.34 | 0.26 |
| Standard Deviation (Population) | 0.34 | 0.26 |
Similar Demographics by Average Family Size
Demographics Similar to Immigrants from Pakistan by Average Family Size
In terms of average family size, the demographic groups most similar to Immigrants from Pakistan are Immigrants from Cameroon (3.30, a difference of 0.010%), Peruvian (3.30, a difference of 0.020%), Sierra Leonean (3.30, a difference of 0.12%), Immigrants from Lebanon (3.30, a difference of 0.13%), and Menominee (3.30, a difference of 0.15%).
| Demographics | Rating | Rank | Average Family Size |
| Immigrants | Nigeria | 99.7 /100 | #84 | Exceptional 3.32 |
| Afghans | 99.7 /100 | #85 | Exceptional 3.31 |
| Jamaicans | 99.7 /100 | #86 | Exceptional 3.31 |
| Immigrants | Peru | 99.7 /100 | #87 | Exceptional 3.31 |
| Immigrants | Bolivia | 99.6 /100 | #88 | Exceptional 3.31 |
| Malaysians | 99.6 /100 | #89 | Exceptional 3.31 |
| Menominee | 99.4 /100 | #90 | Exceptional 3.30 |
| Immigrants | Pakistan | 99.2 /100 | #91 | Exceptional 3.30 |
| Immigrants | Cameroon | 99.2 /100 | #92 | Exceptional 3.30 |
| Peruvians | 99.2 /100 | #93 | Exceptional 3.30 |
| Sierra Leoneans | 99.0 /100 | #94 | Exceptional 3.30 |
| Immigrants | Lebanon | 99.0 /100 | #95 | Exceptional 3.30 |
| U.S. Virgin Islanders | 98.8 /100 | #96 | Exceptional 3.29 |
| Immigrants | Oceania | 98.7 /100 | #97 | Exceptional 3.29 |
| Barbadians | 98.6 /100 | #98 | Exceptional 3.29 |
Demographics Similar to Immigrants from Uzbekistan by Average Family Size
In terms of average family size, the demographic groups most similar to Immigrants from Uzbekistan are Seminole (3.24, a difference of 0.020%), Immigrants from Taiwan (3.24, a difference of 0.020%), Iraqi (3.24, a difference of 0.050%), Immigrants from Egypt (3.24, a difference of 0.060%), and Ethiopian (3.24, a difference of 0.060%).
| Demographics | Rating | Rank | Average Family Size |
| Indians (Asian) | 73.6 /100 | #150 | Good 3.24 |
| Jordanians | 73.5 /100 | #151 | Good 3.24 |
| Spanish Americans | 72.5 /100 | #152 | Good 3.24 |
| Immigrants | Eritrea | 71.4 /100 | #153 | Good 3.24 |
| Immigrants | Egypt | 70.0 /100 | #154 | Good 3.24 |
| Seminole | 68.2 /100 | #155 | Good 3.24 |
| Immigrants | Taiwan | 68.1 /100 | #156 | Good 3.24 |
| Immigrants | Uzbekistan | 67.0 /100 | #157 | Good 3.24 |
| Iraqis | 64.3 /100 | #158 | Good 3.24 |
| Ethiopians | 63.9 /100 | #159 | Good 3.24 |
| Immigrants | Iraq | 63.7 /100 | #160 | Good 3.24 |
| Immigrants | Chile | 63.2 /100 | #161 | Good 3.24 |
| Immigrants | Uganda | 60.1 /100 | #162 | Good 3.23 |
| Uruguayans | 58.8 /100 | #163 | Average 3.23 |
| Egyptians | 58.6 /100 | #164 | Average 3.23 |