Immigrants from North Macedonia vs Immigrants from Israel Single Father Households
COMPARE
Immigrants from North Macedonia
Immigrants from Israel
Single Father Households
Single Father Households Comparison
Immigrants from North Macedonia
Immigrants from Israel
2.0%
SINGLE FATHER HOUSEHOLDS
99.9/ 100
METRIC RATING
59th/ 347
METRIC RANK
1.8%
SINGLE FATHER HOUSEHOLDS
100.0/ 100
METRIC RATING
2nd/ 347
METRIC RANK
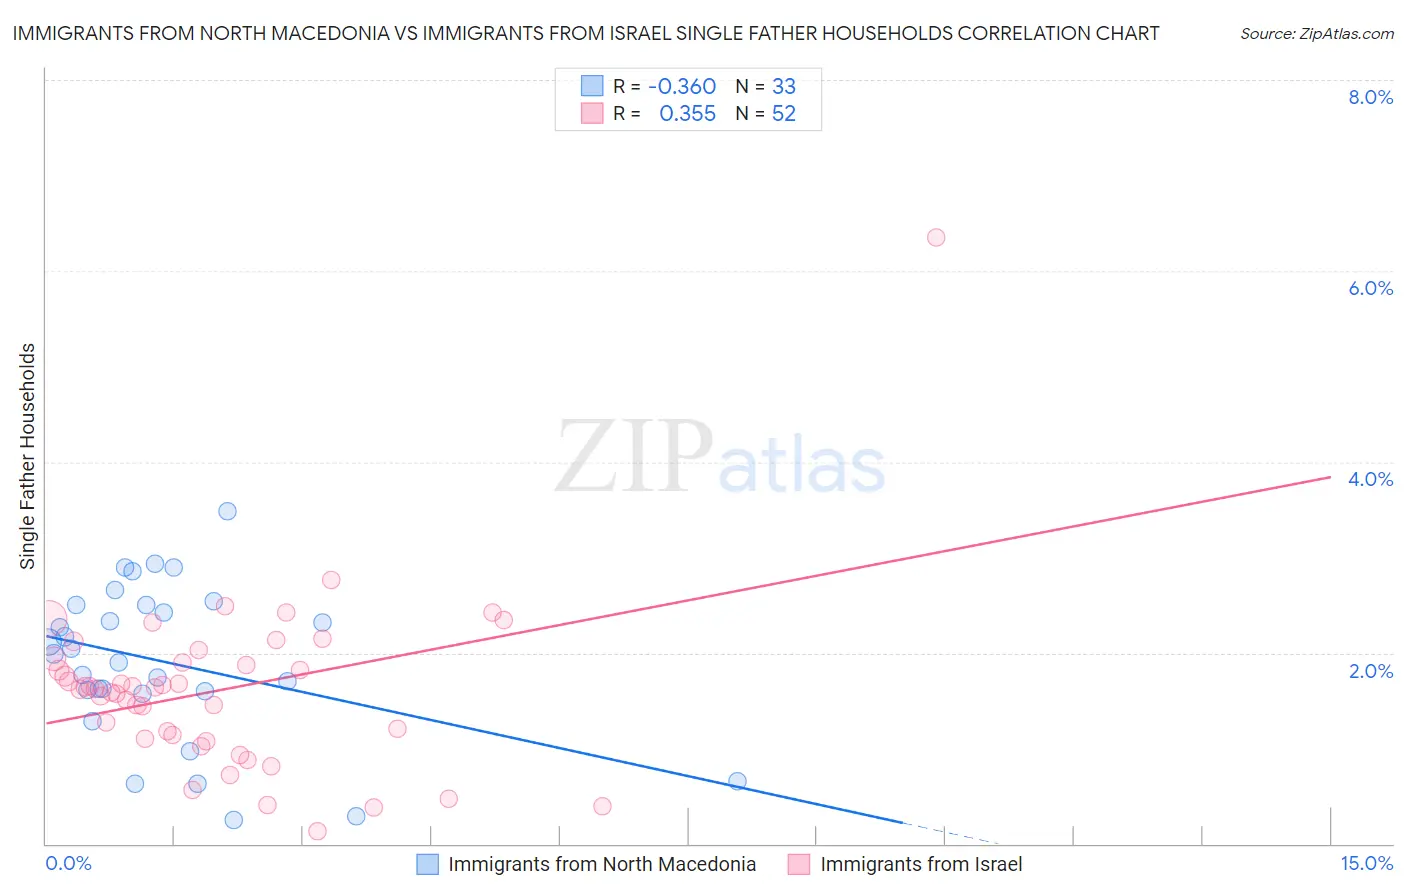
Immigrants from North Macedonia vs Immigrants from Israel Single Father Households Correlation Chart
The statistical analysis conducted on geographies consisting of 74,159,006 people shows a mild negative correlation between the proportion of Immigrants from North Macedonia and percentage of single father households in the United States with a correlation coefficient (R) of -0.360 and weighted average of 2.0%. Similarly, the statistical analysis conducted on geographies consisting of 208,787,114 people shows a mild positive correlation between the proportion of Immigrants from Israel and percentage of single father households in the United States with a correlation coefficient (R) of 0.355 and weighted average of 1.8%, a difference of 13.4%.
Single Father Households Correlation Summary
| Measurement | Immigrants from North Macedonia | Immigrants from Israel |
| Minimum | 0.24% | 0.13% |
| Maximum | 3.5% | 6.3% |
| Range | 3.2% | 6.2% |
| Mean | 1.9% | 1.6% |
| Median | 2.0% | 1.6% |
| Interquartile 25% (IQ1) | 1.6% | 1.1% |
| Interquartile 75% (IQ3) | 2.5% | 1.9% |
| Interquartile Range (IQR) | 0.92% | 0.80% |
| Standard Deviation (Sample) | 0.81% | 0.91% |
| Standard Deviation (Population) | 0.80% | 0.90% |
Similar Demographics by Single Father Households
Demographics Similar to Immigrants from North Macedonia by Single Father Households
In terms of single father households, the demographic groups most similar to Immigrants from North Macedonia are Immigrants from Austria (2.0%, a difference of 0.010%), Immigrants from Czechoslovakia (2.0%, a difference of 0.11%), Burmese (2.0%, a difference of 0.13%), Vietnamese (2.0%, a difference of 0.25%), and Immigrants from Norway (2.0%, a difference of 0.39%).
| Demographics | Rating | Rank | Single Father Households |
| Immigrants | Europe | 99.9 /100 | #52 | Exceptional 2.0% |
| Immigrants | Northern Europe | 99.9 /100 | #53 | Exceptional 2.0% |
| Immigrants | Korea | 99.9 /100 | #54 | Exceptional 2.0% |
| Immigrants | France | 99.9 /100 | #55 | Exceptional 2.0% |
| Immigrants | Norway | 99.9 /100 | #56 | Exceptional 2.0% |
| Burmese | 99.9 /100 | #57 | Exceptional 2.0% |
| Immigrants | Czechoslovakia | 99.9 /100 | #58 | Exceptional 2.0% |
| Immigrants | North Macedonia | 99.9 /100 | #59 | Exceptional 2.0% |
| Immigrants | Austria | 99.9 /100 | #60 | Exceptional 2.0% |
| Vietnamese | 99.9 /100 | #61 | Exceptional 2.0% |
| Immigrants | Malaysia | 99.9 /100 | #62 | Exceptional 2.0% |
| Maltese | 99.9 /100 | #63 | Exceptional 2.0% |
| Mongolians | 99.9 /100 | #64 | Exceptional 2.1% |
| Paraguayans | 99.9 /100 | #65 | Exceptional 2.1% |
| Immigrants | Western Asia | 99.8 /100 | #66 | Exceptional 2.1% |
Demographics Similar to Immigrants from Israel by Single Father Households
In terms of single father households, the demographic groups most similar to Immigrants from Israel are Soviet Union (1.8%, a difference of 0.040%), Filipino (1.8%, a difference of 0.42%), Immigrants from Uzbekistan (1.8%, a difference of 1.1%), Immigrants from Hong Kong (1.8%, a difference of 2.0%), and Immigrants from Taiwan (1.8%, a difference of 2.4%).
| Demographics | Rating | Rank | Single Father Households |
| Soviet Union | 100.0 /100 | #1 | Exceptional 1.8% |
| Immigrants | Israel | 100.0 /100 | #2 | Exceptional 1.8% |
| Filipinos | 100.0 /100 | #3 | Exceptional 1.8% |
| Immigrants | Uzbekistan | 100.0 /100 | #4 | Exceptional 1.8% |
| Immigrants | Hong Kong | 100.0 /100 | #5 | Exceptional 1.8% |
| Immigrants | Taiwan | 100.0 /100 | #6 | Exceptional 1.8% |
| Cypriots | 100.0 /100 | #7 | Exceptional 1.8% |
| Immigrants | Ireland | 100.0 /100 | #8 | Exceptional 1.8% |
| Immigrants | China | 100.0 /100 | #9 | Exceptional 1.8% |
| Okinawans | 100.0 /100 | #10 | Exceptional 1.9% |
| Immigrants | Belarus | 100.0 /100 | #11 | Exceptional 1.9% |
| Immigrants | Greece | 100.0 /100 | #12 | Exceptional 1.9% |
| Immigrants | Singapore | 100.0 /100 | #13 | Exceptional 1.9% |
| Immigrants | Lithuania | 100.0 /100 | #14 | Exceptional 1.9% |
| Immigrants | Eastern Asia | 100.0 /100 | #15 | Exceptional 1.9% |