Immigrants from North America vs Immigrants from Asia Family Households with Children
COMPARE
Immigrants from North America
Immigrants from Asia
Family Households with Children
Family Households with Children Comparison
Immigrants from North America
Immigrants from Asia
26.6%
FAMILY HOUSEHOLDS WITH CHILDREN
0.3/ 100
METRIC RATING
283rd/ 347
METRIC RANK
28.8%
FAMILY HOUSEHOLDS WITH CHILDREN
100.0/ 100
METRIC RATING
55th/ 347
METRIC RANK
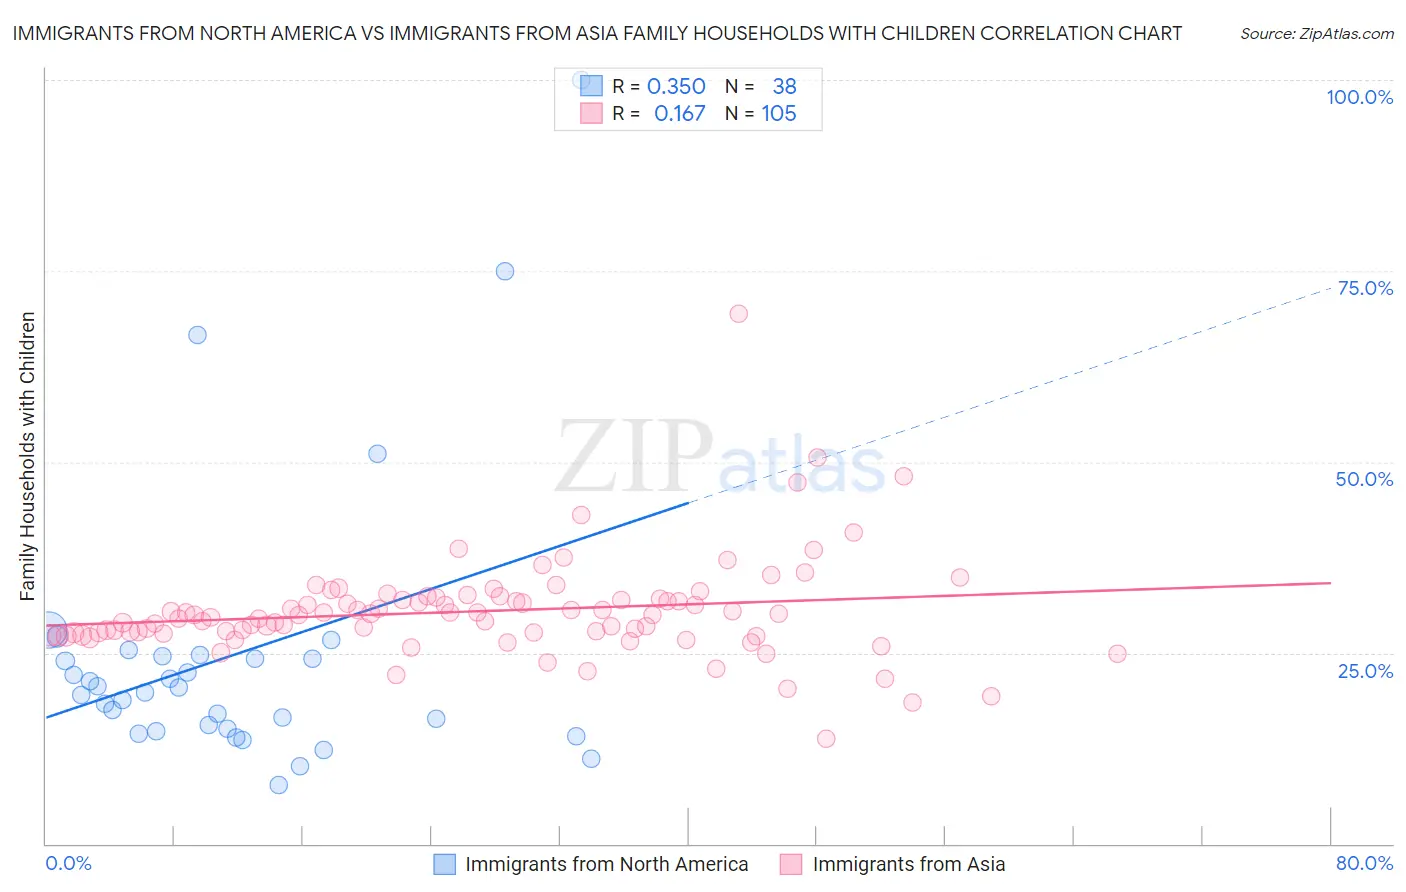
Immigrants from North America vs Immigrants from Asia Family Households with Children Correlation Chart
The statistical analysis conducted on geographies consisting of 461,965,747 people shows a mild positive correlation between the proportion of Immigrants from North America and percentage of family households with children in the United States with a correlation coefficient (R) of 0.350 and weighted average of 26.6%. Similarly, the statistical analysis conducted on geographies consisting of 548,215,399 people shows a poor positive correlation between the proportion of Immigrants from Asia and percentage of family households with children in the United States with a correlation coefficient (R) of 0.167 and weighted average of 28.8%, a difference of 8.6%.
Family Households with Children Correlation Summary
| Measurement | Immigrants from North America | Immigrants from Asia |
| Minimum | 7.6% | 13.7% |
| Maximum | 100.0% | 69.4% |
| Range | 92.4% | 55.7% |
| Mean | 24.6% | 30.4% |
| Median | 20.1% | 29.9% |
| Interquartile 25% (IQ1) | 15.0% | 27.6% |
| Interquartile 75% (IQ3) | 24.6% | 32.0% |
| Interquartile Range (IQR) | 9.6% | 4.5% |
| Standard Deviation (Sample) | 18.5% | 6.6% |
| Standard Deviation (Population) | 18.3% | 6.6% |
Similar Demographics by Family Households with Children
Demographics Similar to Immigrants from North America by Family Households with Children
In terms of family households with children, the demographic groups most similar to Immigrants from North America are Immigrants from Canada (26.5%, a difference of 0.020%), Cambodian (26.5%, a difference of 0.050%), French American Indian (26.6%, a difference of 0.070%), Lithuanian (26.6%, a difference of 0.080%), and Immigrants from Senegal (26.5%, a difference of 0.10%).
| Demographics | Rating | Rank | Family Households with Children |
| Immigrants | Spain | 0.5 /100 | #276 | Tragic 26.6% |
| Celtics | 0.4 /100 | #277 | Tragic 26.6% |
| Immigrants | Europe | 0.4 /100 | #278 | Tragic 26.6% |
| Finns | 0.4 /100 | #279 | Tragic 26.6% |
| Senegalese | 0.4 /100 | #280 | Tragic 26.6% |
| Lithuanians | 0.3 /100 | #281 | Tragic 26.6% |
| French American Indians | 0.3 /100 | #282 | Tragic 26.6% |
| Immigrants | North America | 0.3 /100 | #283 | Tragic 26.6% |
| Immigrants | Canada | 0.3 /100 | #284 | Tragic 26.5% |
| Cambodians | 0.2 /100 | #285 | Tragic 26.5% |
| Immigrants | Senegal | 0.2 /100 | #286 | Tragic 26.5% |
| Shoshone | 0.2 /100 | #287 | Tragic 26.5% |
| Russians | 0.2 /100 | #288 | Tragic 26.5% |
| Immigrants | Sweden | 0.2 /100 | #289 | Tragic 26.5% |
| Albanians | 0.2 /100 | #290 | Tragic 26.5% |
Demographics Similar to Immigrants from Asia by Family Households with Children
In terms of family households with children, the demographic groups most similar to Immigrants from Asia are Sierra Leonean (28.9%, a difference of 0.060%), Immigrants from Guatemala (28.8%, a difference of 0.070%), Immigrants from Cambodia (28.9%, a difference of 0.14%), Guatemalan (28.9%, a difference of 0.21%), and Immigrants from Peru (28.9%, a difference of 0.29%).
| Demographics | Rating | Rank | Family Households with Children |
| Apache | 100.0 /100 | #48 | Exceptional 29.0% |
| Jordanians | 100.0 /100 | #49 | Exceptional 29.0% |
| Immigrants | Immigrants | 100.0 /100 | #50 | Exceptional 28.9% |
| Immigrants | Peru | 100.0 /100 | #51 | Exceptional 28.9% |
| Guatemalans | 100.0 /100 | #52 | Exceptional 28.9% |
| Immigrants | Cambodia | 100.0 /100 | #53 | Exceptional 28.9% |
| Sierra Leoneans | 100.0 /100 | #54 | Exceptional 28.9% |
| Immigrants | Asia | 100.0 /100 | #55 | Exceptional 28.8% |
| Immigrants | Guatemala | 100.0 /100 | #56 | Exceptional 28.8% |
| Danes | 100.0 /100 | #57 | Exceptional 28.7% |
| Hawaiians | 100.0 /100 | #58 | Exceptional 28.7% |
| Immigrants | Nigeria | 100.0 /100 | #59 | Exceptional 28.6% |
| Hmong | 99.9 /100 | #60 | Exceptional 28.6% |
| Immigrants | Ghana | 99.9 /100 | #61 | Exceptional 28.6% |
| Egyptians | 99.9 /100 | #62 | Exceptional 28.6% |