Immigrants from Nicaragua vs Yaqui Divorced or Separated
COMPARE
Immigrants from Nicaragua
Yaqui
Divorced or Separated
Divorced or Separated Comparison
Immigrants from Nicaragua
Yaqui
13.3%
DIVORCED OR SEPARATED
0.0/ 100
METRIC RATING
313th/ 347
METRIC RANK
13.3%
DIVORCED OR SEPARATED
0.0/ 100
METRIC RATING
314th/ 347
METRIC RANK
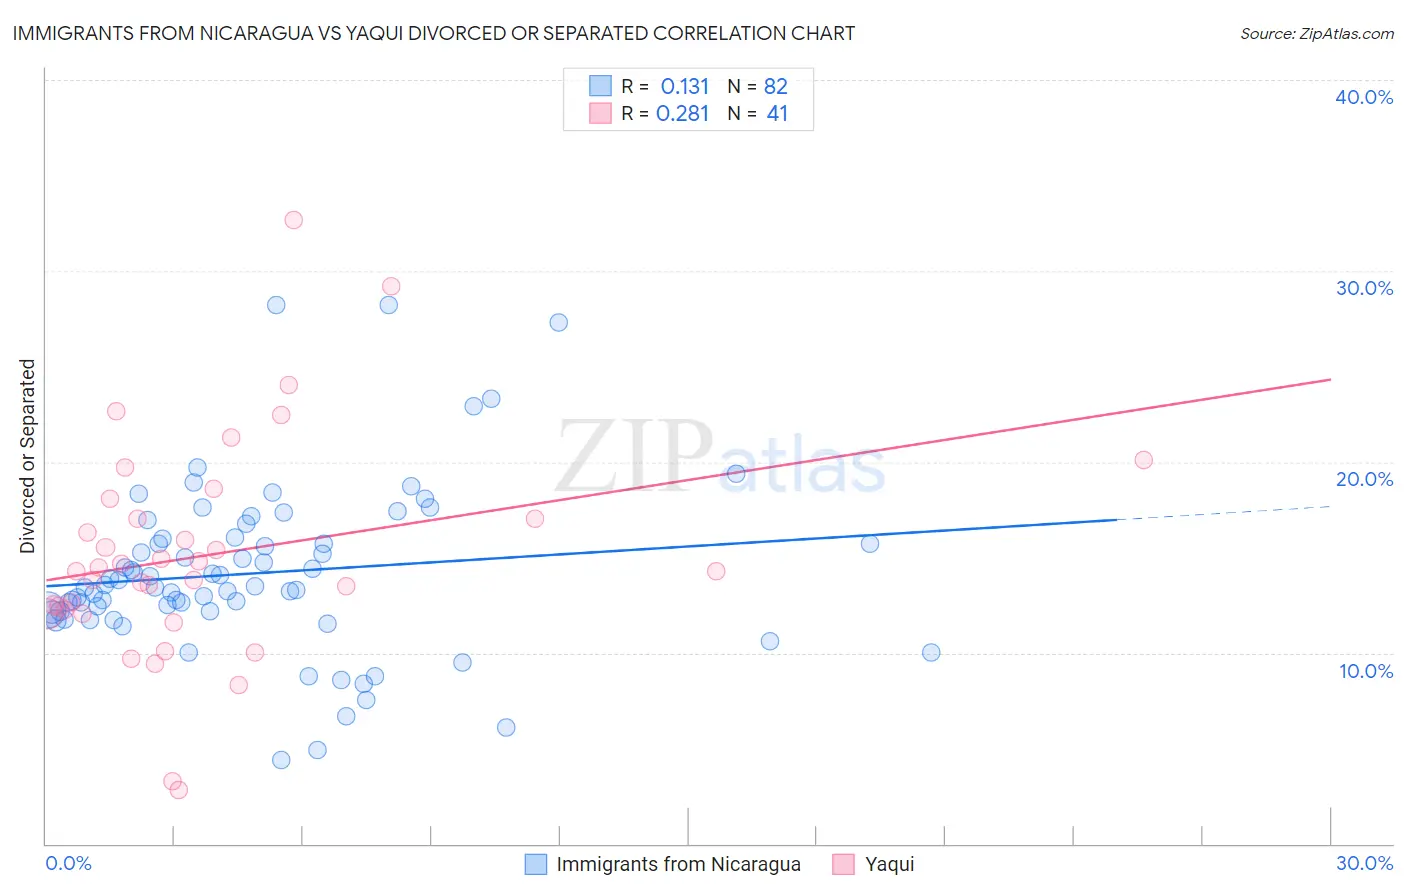
Immigrants from Nicaragua vs Yaqui Divorced or Separated Correlation Chart
The statistical analysis conducted on geographies consisting of 236,337,716 people shows a poor positive correlation between the proportion of Immigrants from Nicaragua and percentage of population currently divorced or separated in the United States with a correlation coefficient (R) of 0.131 and weighted average of 13.3%. Similarly, the statistical analysis conducted on geographies consisting of 107,734,723 people shows a weak positive correlation between the proportion of Yaqui and percentage of population currently divorced or separated in the United States with a correlation coefficient (R) of 0.281 and weighted average of 13.3%, a difference of 0.010%.
Divorced or Separated Correlation Summary
| Measurement | Immigrants from Nicaragua | Yaqui |
| Minimum | 4.4% | 2.8% |
| Maximum | 28.2% | 32.7% |
| Range | 23.8% | 29.9% |
| Mean | 14.2% | 15.1% |
| Median | 13.5% | 14.3% |
| Interquartile 25% (IQ1) | 12.2% | 12.2% |
| Interquartile 75% (IQ3) | 16.0% | 17.5% |
| Interquartile Range (IQR) | 3.8% | 5.4% |
| Standard Deviation (Sample) | 4.4% | 5.8% |
| Standard Deviation (Population) | 4.4% | 5.7% |
Demographics Similar to Immigrants from Nicaragua and Yaqui by Divorced or Separated
In terms of divorced or separated, the demographic groups most similar to Immigrants from Nicaragua are Blackfeet (13.3%, a difference of 0.19%), Spanish American (13.3%, a difference of 0.24%), Tsimshian (13.3%, a difference of 0.27%), Haitian (13.3%, a difference of 0.29%), and Cree (13.4%, a difference of 0.32%). Similarly, the demographic groups most similar to Yaqui are Blackfeet (13.3%, a difference of 0.21%), Spanish American (13.3%, a difference of 0.23%), Tsimshian (13.3%, a difference of 0.26%), Haitian (13.3%, a difference of 0.28%), and Cree (13.4%, a difference of 0.31%).
| Demographics | Rating | Rank | Divorced or Separated |
| Cape Verdeans | 0.0 /100 | #303 | Tragic 13.1% |
| Hopi | 0.0 /100 | #304 | Tragic 13.2% |
| Chippewa | 0.0 /100 | #305 | Tragic 13.2% |
| Tlingit-Haida | 0.0 /100 | #306 | Tragic 13.2% |
| French American Indians | 0.0 /100 | #307 | Tragic 13.2% |
| Ottawa | 0.0 /100 | #308 | Tragic 13.2% |
| Americans | 0.0 /100 | #309 | Tragic 13.2% |
| Africans | 0.0 /100 | #310 | Tragic 13.2% |
| Sioux | 0.0 /100 | #311 | Tragic 13.2% |
| Blackfeet | 0.0 /100 | #312 | Tragic 13.3% |
| Immigrants | Nicaragua | 0.0 /100 | #313 | Tragic 13.3% |
| Yaqui | 0.0 /100 | #314 | Tragic 13.3% |
| Spanish Americans | 0.0 /100 | #315 | Tragic 13.3% |
| Tsimshian | 0.0 /100 | #316 | Tragic 13.3% |
| Haitians | 0.0 /100 | #317 | Tragic 13.3% |
| Cree | 0.0 /100 | #318 | Tragic 13.4% |
| Puget Sound Salish | 0.0 /100 | #319 | Tragic 13.4% |
| Cajuns | 0.0 /100 | #320 | Tragic 13.4% |
| Cheyenne | 0.0 /100 | #321 | Tragic 13.4% |
| Immigrants | Haiti | 0.0 /100 | #322 | Tragic 13.4% |
| U.S. Virgin Islanders | 0.0 /100 | #323 | Tragic 13.4% |