Immigrants from Nicaragua vs Cuban Births to Unmarried Women
COMPARE
Immigrants from Nicaragua
Cuban
Births to Unmarried Women
Births to Unmarried Women Comparison
Immigrants from Nicaragua
Cubans
38.0%
BIRTHS TO UNMARRIED WOMEN
0.0/ 100
METRIC RATING
293rd/ 347
METRIC RANK
39.4%
BIRTHS TO UNMARRIED WOMEN
0.0/ 100
METRIC RATING
309th/ 347
METRIC RANK
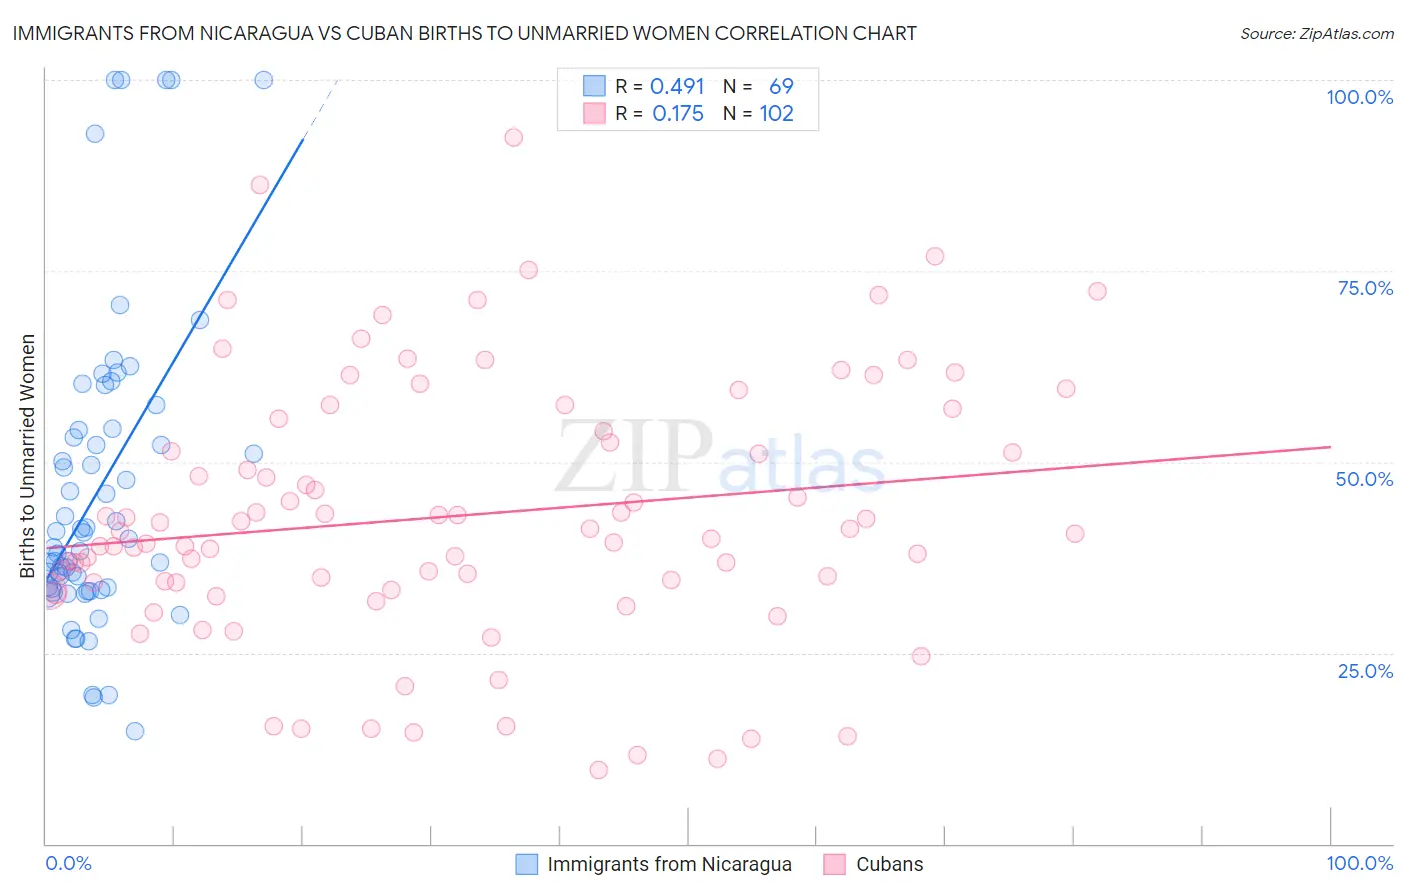
Immigrants from Nicaragua vs Cuban Births to Unmarried Women Correlation Chart
The statistical analysis conducted on geographies consisting of 229,303,560 people shows a moderate positive correlation between the proportion of Immigrants from Nicaragua and percentage of births to unmarried women in the United States with a correlation coefficient (R) of 0.491 and weighted average of 38.0%. Similarly, the statistical analysis conducted on geographies consisting of 417,413,482 people shows a poor positive correlation between the proportion of Cubans and percentage of births to unmarried women in the United States with a correlation coefficient (R) of 0.175 and weighted average of 39.4%, a difference of 3.7%.
Births to Unmarried Women Correlation Summary
| Measurement | Immigrants from Nicaragua | Cuban |
| Minimum | 14.7% | 9.6% |
| Maximum | 100.0% | 92.5% |
| Range | 85.3% | 82.9% |
| Mean | 46.4% | 42.9% |
| Median | 40.0% | 40.7% |
| Interquartile 25% (IQ1) | 33.3% | 34.2% |
| Interquartile 75% (IQ3) | 54.2% | 54.0% |
| Interquartile Range (IQR) | 21.0% | 19.8% |
| Standard Deviation (Sample) | 20.4% | 17.0% |
| Standard Deviation (Population) | 20.2% | 16.9% |
Demographics Similar to Immigrants from Nicaragua and Cubans by Births to Unmarried Women
In terms of births to unmarried women, the demographic groups most similar to Immigrants from Nicaragua are British West Indian (38.0%, a difference of 0.050%), Blackfeet (37.9%, a difference of 0.15%), Seminole (37.9%, a difference of 0.20%), Iroquois (38.2%, a difference of 0.60%), and Alaska Native (38.3%, a difference of 0.85%). Similarly, the demographic groups most similar to Cubans are Aleut (39.3%, a difference of 0.12%), Immigrants from Honduras (39.3%, a difference of 0.21%), Immigrants from Dominica (39.5%, a difference of 0.22%), Immigrants from the Azores (39.6%, a difference of 0.46%), and Central American Indian (39.0%, a difference of 1.1%).
| Demographics | Rating | Rank | Births to Unmarried Women |
| Seminole | 0.0 /100 | #291 | Tragic 37.9% |
| Blackfeet | 0.0 /100 | #292 | Tragic 37.9% |
| Immigrants | Nicaragua | 0.0 /100 | #293 | Tragic 38.0% |
| British West Indians | 0.0 /100 | #294 | Tragic 38.0% |
| Iroquois | 0.0 /100 | #295 | Tragic 38.2% |
| Alaska Natives | 0.0 /100 | #296 | Tragic 38.3% |
| Dutch West Indians | 0.0 /100 | #297 | Tragic 38.4% |
| Jamaicans | 0.0 /100 | #298 | Tragic 38.5% |
| Spanish Americans | 0.0 /100 | #299 | Tragic 38.6% |
| Immigrants | West Indies | 0.0 /100 | #300 | Tragic 38.6% |
| Haitians | 0.0 /100 | #301 | Tragic 38.6% |
| Hondurans | 0.0 /100 | #302 | Tragic 38.7% |
| Immigrants | Jamaica | 0.0 /100 | #303 | Tragic 38.8% |
| Yaqui | 0.0 /100 | #304 | Tragic 38.8% |
| Immigrants | Haiti | 0.0 /100 | #305 | Tragic 38.9% |
| Central American Indians | 0.0 /100 | #306 | Tragic 39.0% |
| Immigrants | Honduras | 0.0 /100 | #307 | Tragic 39.3% |
| Aleuts | 0.0 /100 | #308 | Tragic 39.3% |
| Cubans | 0.0 /100 | #309 | Tragic 39.4% |
| Immigrants | Dominica | 0.0 /100 | #310 | Tragic 39.5% |
| Immigrants | Azores | 0.0 /100 | #311 | Tragic 39.6% |