Immigrants from Morocco vs Immigrants from Western Europe Family Households with Children
COMPARE
Immigrants from Morocco
Immigrants from Western Europe
Family Households with Children
Family Households with Children Comparison
Immigrants from Morocco
Immigrants from Western Europe
27.0%
FAMILY HOUSEHOLDS WITH CHILDREN
4.2/ 100
METRIC RATING
235th/ 347
METRIC RANK
26.4%
FAMILY HOUSEHOLDS WITH CHILDREN
0.1/ 100
METRIC RATING
298th/ 347
METRIC RANK
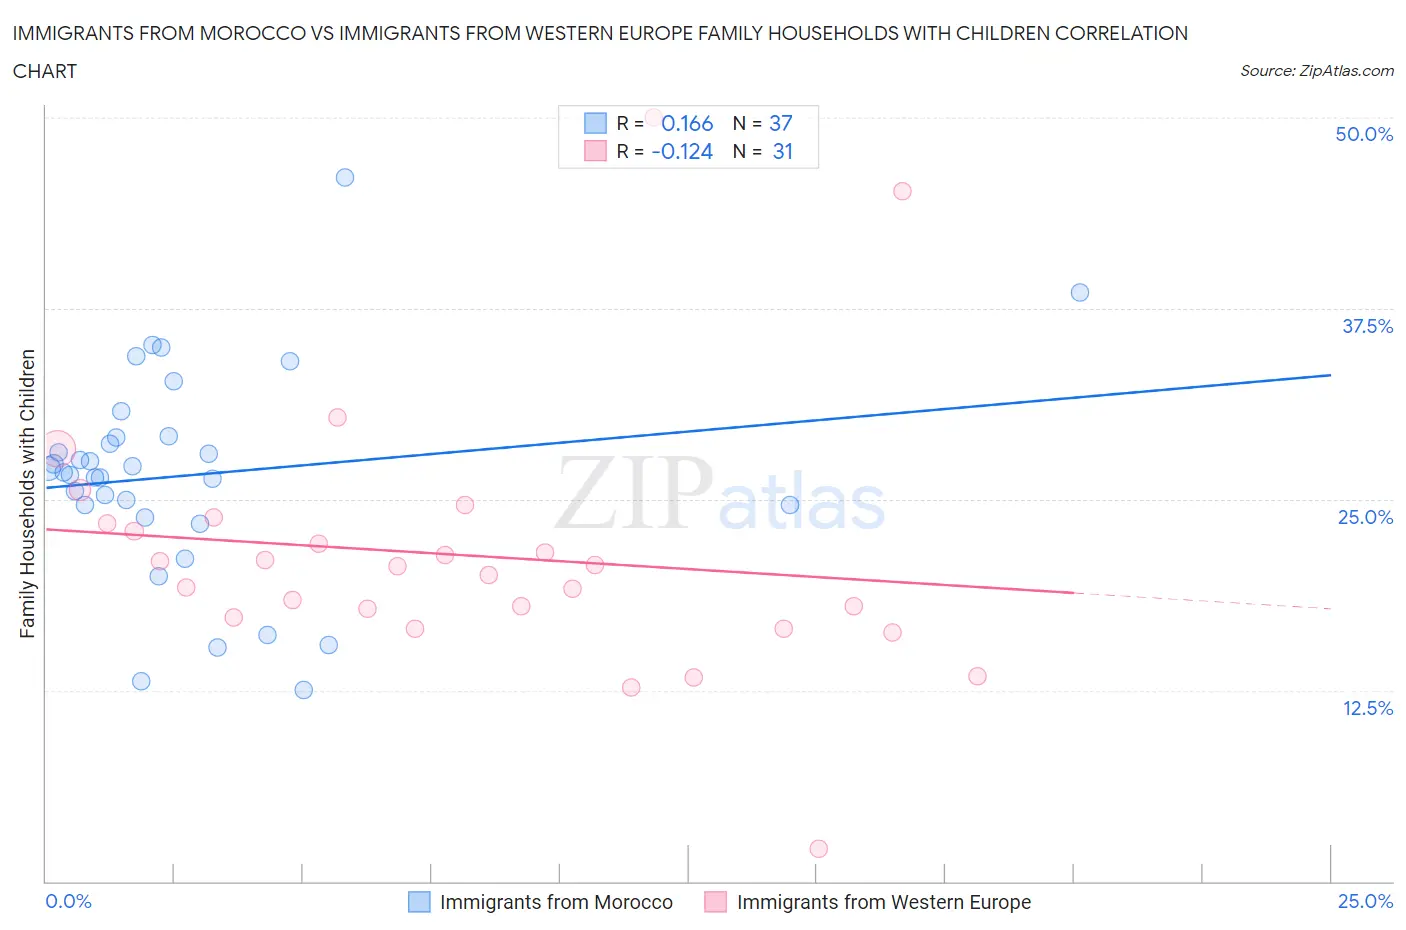
Immigrants from Morocco vs Immigrants from Western Europe Family Households with Children Correlation Chart
The statistical analysis conducted on geographies consisting of 178,874,174 people shows a poor positive correlation between the proportion of Immigrants from Morocco and percentage of family households with children in the United States with a correlation coefficient (R) of 0.166 and weighted average of 27.0%. Similarly, the statistical analysis conducted on geographies consisting of 493,573,266 people shows a poor negative correlation between the proportion of Immigrants from Western Europe and percentage of family households with children in the United States with a correlation coefficient (R) of -0.124 and weighted average of 26.4%, a difference of 2.2%.
Family Households with Children Correlation Summary
| Measurement | Immigrants from Morocco | Immigrants from Western Europe |
| Minimum | 12.6% | 2.1% |
| Maximum | 46.1% | 50.0% |
| Range | 33.5% | 47.9% |
| Mean | 26.6% | 21.3% |
| Median | 26.8% | 20.6% |
| Interquartile 25% (IQ1) | 24.2% | 17.2% |
| Interquartile 75% (IQ3) | 29.1% | 23.4% |
| Interquartile Range (IQR) | 4.9% | 6.2% |
| Standard Deviation (Sample) | 6.9% | 8.7% |
| Standard Deviation (Population) | 6.8% | 8.6% |
Similar Demographics by Family Households with Children
Demographics Similar to Immigrants from Morocco by Family Households with Children
In terms of family households with children, the demographic groups most similar to Immigrants from Morocco are Immigrants from Germany (27.0%, a difference of 0.040%), Cape Verdean (26.9%, a difference of 0.090%), Immigrants from Italy (27.0%, a difference of 0.11%), Immigrants from Netherlands (26.9%, a difference of 0.11%), and Yugoslavian (27.0%, a difference of 0.12%).
| Demographics | Rating | Rank | Family Households with Children |
| Scottish | 6.5 /100 | #228 | Tragic 27.0% |
| Immigrants | Caribbean | 6.3 /100 | #229 | Tragic 27.0% |
| Bulgarians | 5.8 /100 | #230 | Tragic 27.0% |
| Luxembourgers | 5.5 /100 | #231 | Tragic 27.0% |
| Yugoslavians | 5.1 /100 | #232 | Tragic 27.0% |
| Immigrants | Italy | 5.0 /100 | #233 | Tragic 27.0% |
| Immigrants | Germany | 4.4 /100 | #234 | Tragic 27.0% |
| Immigrants | Morocco | 4.2 /100 | #235 | Tragic 27.0% |
| Cape Verdeans | 3.6 /100 | #236 | Tragic 26.9% |
| Immigrants | Netherlands | 3.5 /100 | #237 | Tragic 26.9% |
| Moroccans | 3.4 /100 | #238 | Tragic 26.9% |
| Immigrants | Southern Europe | 3.4 /100 | #239 | Tragic 26.9% |
| Immigrants | Bulgaria | 3.3 /100 | #240 | Tragic 26.9% |
| Navajo | 3.2 /100 | #241 | Tragic 26.9% |
| Immigrants | England | 3.2 /100 | #242 | Tragic 26.9% |
Demographics Similar to Immigrants from Western Europe by Family Households with Children
In terms of family households with children, the demographic groups most similar to Immigrants from Western Europe are Trinidadian and Tobagonian (26.4%, a difference of 0.010%), Armenian (26.4%, a difference of 0.10%), Croatian (26.4%, a difference of 0.11%), Macedonian (26.4%, a difference of 0.13%), and Paiute (26.4%, a difference of 0.13%).
| Demographics | Rating | Rank | Family Households with Children |
| Bahamians | 0.2 /100 | #291 | Tragic 26.5% |
| Poles | 0.2 /100 | #292 | Tragic 26.5% |
| Blacks/African Americans | 0.1 /100 | #293 | Tragic 26.5% |
| Latvians | 0.1 /100 | #294 | Tragic 26.4% |
| Macedonians | 0.1 /100 | #295 | Tragic 26.4% |
| Croatians | 0.1 /100 | #296 | Tragic 26.4% |
| Armenians | 0.1 /100 | #297 | Tragic 26.4% |
| Immigrants | Western Europe | 0.1 /100 | #298 | Tragic 26.4% |
| Trinidadians and Tobagonians | 0.1 /100 | #299 | Tragic 26.4% |
| Paiute | 0.1 /100 | #300 | Tragic 26.4% |
| Immigrants | Trinidad and Tobago | 0.1 /100 | #301 | Tragic 26.4% |
| Serbians | 0.1 /100 | #302 | Tragic 26.4% |
| Immigrants | Guyana | 0.1 /100 | #303 | Tragic 26.3% |
| Immigrants | Bahamas | 0.1 /100 | #304 | Tragic 26.3% |
| Guyanese | 0.1 /100 | #305 | Tragic 26.3% |