Immigrants from Moldova vs Immigrants from Southern Europe Births to Unmarried Women
COMPARE
Immigrants from Moldova
Immigrants from Southern Europe
Births to Unmarried Women
Births to Unmarried Women Comparison
Immigrants from Moldova
Immigrants from Southern Europe
27.3%
BIRTHS TO UNMARRIED WOMEN
99.7/ 100
METRIC RATING
38th/ 347
METRIC RANK
31.1%
BIRTHS TO UNMARRIED WOMEN
68.7/ 100
METRIC RATING
161st/ 347
METRIC RANK
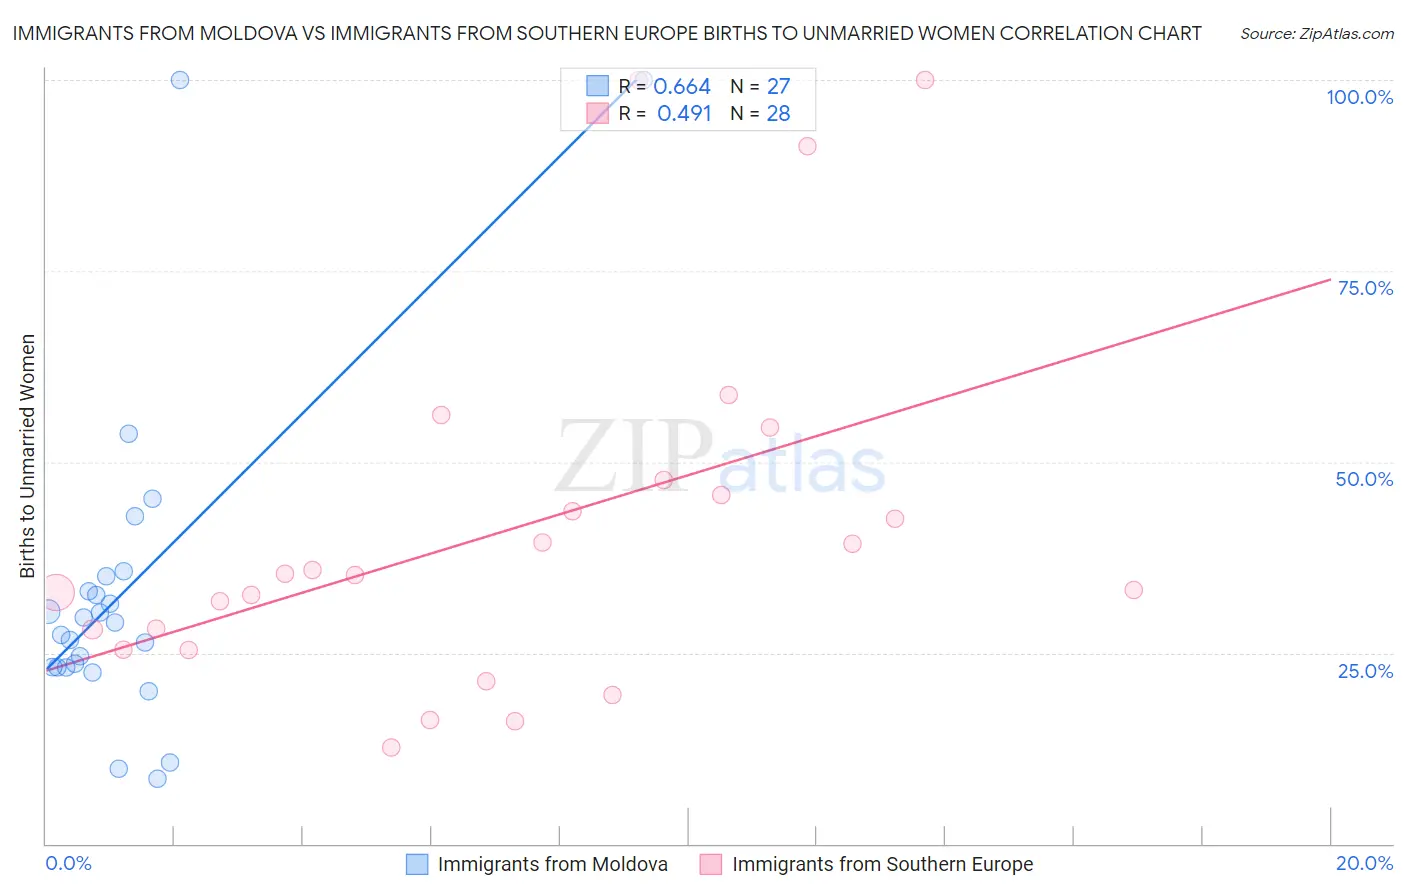
Immigrants from Moldova vs Immigrants from Southern Europe Births to Unmarried Women Correlation Chart
The statistical analysis conducted on geographies consisting of 119,708,058 people shows a significant positive correlation between the proportion of Immigrants from Moldova and percentage of births to unmarried women in the United States with a correlation coefficient (R) of 0.664 and weighted average of 27.3%. Similarly, the statistical analysis conducted on geographies consisting of 371,346,539 people shows a moderate positive correlation between the proportion of Immigrants from Southern Europe and percentage of births to unmarried women in the United States with a correlation coefficient (R) of 0.491 and weighted average of 31.1%, a difference of 13.9%.
Births to Unmarried Women Correlation Summary
| Measurement | Immigrants from Moldova | Immigrants from Southern Europe |
| Minimum | 8.6% | 12.6% |
| Maximum | 100.0% | 100.0% |
| Range | 91.4% | 87.4% |
| Mean | 33.3% | 41.0% |
| Median | 28.9% | 35.3% |
| Interquartile 25% (IQ1) | 23.1% | 26.7% |
| Interquartile 75% (IQ3) | 35.1% | 46.6% |
| Interquartile Range (IQR) | 12.0% | 19.9% |
| Standard Deviation (Sample) | 21.7% | 23.1% |
| Standard Deviation (Population) | 21.3% | 22.7% |
Similar Demographics by Births to Unmarried Women
Demographics Similar to Immigrants from Moldova by Births to Unmarried Women
In terms of births to unmarried women, the demographic groups most similar to Immigrants from Moldova are Immigrants from Ukraine (27.2%, a difference of 0.14%), Immigrants from Western Asia (27.2%, a difference of 0.23%), Immigrants from Malaysia (27.4%, a difference of 0.28%), Immigrants from Ireland (27.2%, a difference of 0.30%), and Immigrants from Pakistan (27.2%, a difference of 0.38%).
| Demographics | Rating | Rank | Births to Unmarried Women |
| Immigrants | Iraq | 99.8 /100 | #31 | Exceptional 27.1% |
| Immigrants | Russia | 99.8 /100 | #32 | Exceptional 27.1% |
| Immigrants | Sri Lanka | 99.8 /100 | #33 | Exceptional 27.2% |
| Immigrants | Pakistan | 99.8 /100 | #34 | Exceptional 27.2% |
| Immigrants | Ireland | 99.7 /100 | #35 | Exceptional 27.2% |
| Immigrants | Western Asia | 99.7 /100 | #36 | Exceptional 27.2% |
| Immigrants | Ukraine | 99.7 /100 | #37 | Exceptional 27.2% |
| Immigrants | Moldova | 99.7 /100 | #38 | Exceptional 27.3% |
| Immigrants | Malaysia | 99.7 /100 | #39 | Exceptional 27.4% |
| Turks | 99.6 /100 | #40 | Exceptional 27.4% |
| Iraqis | 99.6 /100 | #41 | Exceptional 27.6% |
| Immigrants | Eastern Europe | 99.6 /100 | #42 | Exceptional 27.6% |
| Immigrants | Bulgaria | 99.6 /100 | #43 | Exceptional 27.6% |
| Immigrants | Indonesia | 99.5 /100 | #44 | Exceptional 27.7% |
| Latvians | 99.5 /100 | #45 | Exceptional 27.7% |
Demographics Similar to Immigrants from Southern Europe by Births to Unmarried Women
In terms of births to unmarried women, the demographic groups most similar to Immigrants from Southern Europe are Immigrants from England (31.1%, a difference of 0.070%), Immigrants from Western Europe (31.1%, a difference of 0.070%), Austrian (31.0%, a difference of 0.13%), Slovene (31.2%, a difference of 0.31%), and Immigrants from Chile (31.2%, a difference of 0.33%).
| Demographics | Rating | Rank | Births to Unmarried Women |
| Yugoslavians | 75.1 /100 | #154 | Good 30.8% |
| Immigrants | Bangladesh | 73.9 /100 | #155 | Good 30.9% |
| Carpatho Rusyns | 73.5 /100 | #156 | Good 30.9% |
| Immigrants | Eastern Africa | 72.1 /100 | #157 | Good 31.0% |
| Austrians | 69.9 /100 | #158 | Good 31.0% |
| Immigrants | England | 69.4 /100 | #159 | Good 31.1% |
| Immigrants | Western Europe | 69.3 /100 | #160 | Good 31.1% |
| Immigrants | Southern Europe | 68.7 /100 | #161 | Good 31.1% |
| Slovenes | 65.9 /100 | #162 | Good 31.2% |
| Immigrants | Chile | 65.7 /100 | #163 | Good 31.2% |
| Hungarians | 64.1 /100 | #164 | Good 31.2% |
| Immigrants | Somalia | 58.1 /100 | #165 | Average 31.4% |
| Peruvians | 55.5 /100 | #166 | Average 31.5% |
| Dutch | 55.3 /100 | #167 | Average 31.5% |
| Belgians | 52.4 /100 | #168 | Average 31.6% |