Immigrants from Liberia vs Paraguayan Currently Married
COMPARE
Immigrants from Liberia
Paraguayan
Currently Married
Currently Married Comparison
Immigrants from Liberia
Paraguayans
41.8%
CURRENTLY MARRIED
0.0/ 100
METRIC RATING
309th/ 347
METRIC RANK
47.2%
CURRENTLY MARRIED
77.8/ 100
METRIC RATING
137th/ 347
METRIC RANK
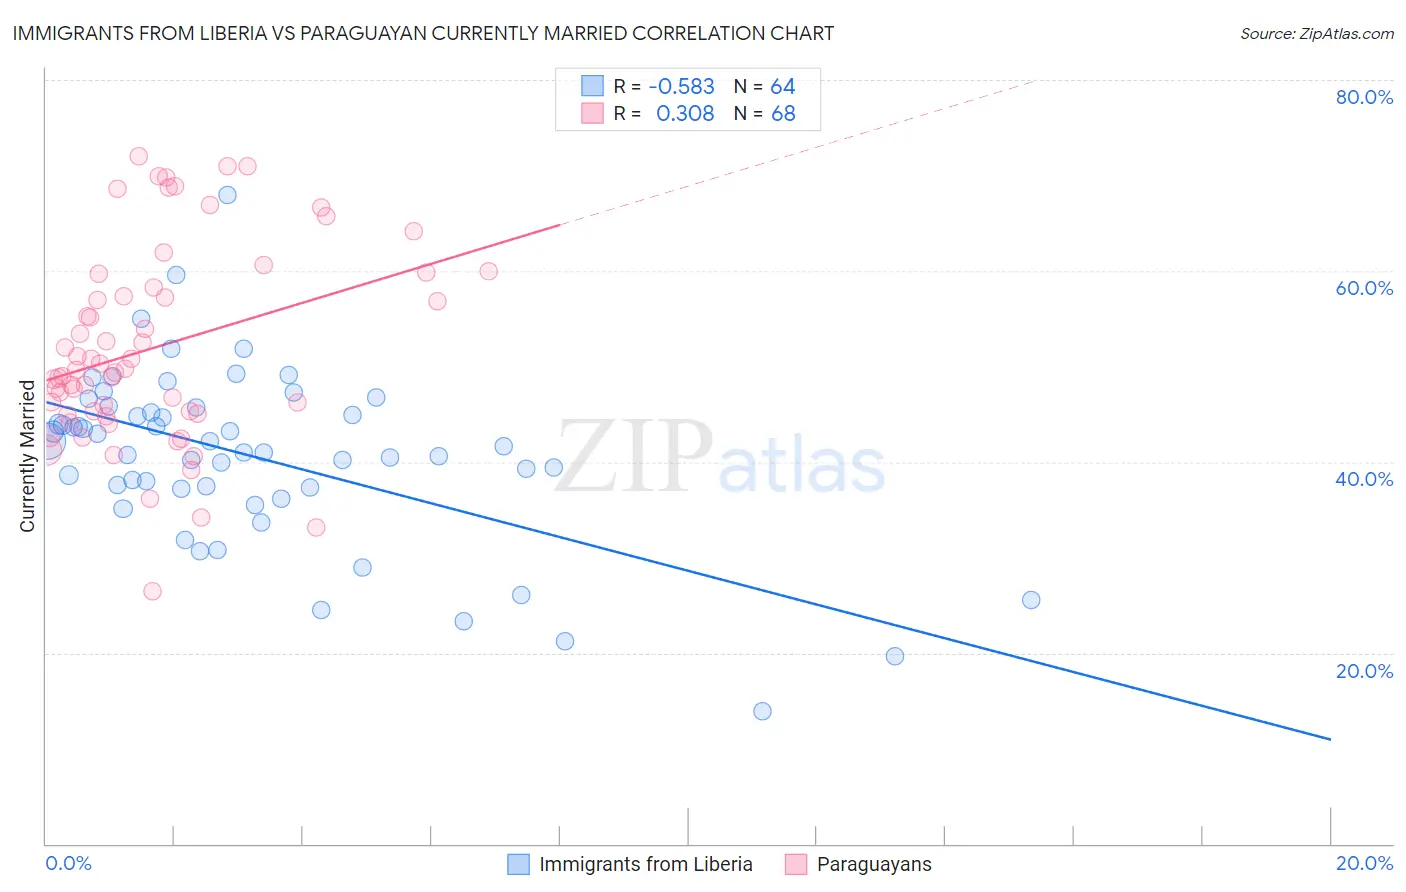
Immigrants from Liberia vs Paraguayan Currently Married Correlation Chart
The statistical analysis conducted on geographies consisting of 135,288,317 people shows a substantial negative correlation between the proportion of Immigrants from Liberia and percentage of population currently married in the United States with a correlation coefficient (R) of -0.583 and weighted average of 41.8%. Similarly, the statistical analysis conducted on geographies consisting of 95,115,093 people shows a mild positive correlation between the proportion of Paraguayans and percentage of population currently married in the United States with a correlation coefficient (R) of 0.308 and weighted average of 47.2%, a difference of 13.0%.
Currently Married Correlation Summary
| Measurement | Immigrants from Liberia | Paraguayan |
| Minimum | 13.9% | 26.5% |
| Maximum | 68.0% | 71.9% |
| Range | 54.1% | 45.4% |
| Mean | 40.5% | 52.0% |
| Median | 41.4% | 49.7% |
| Interquartile 25% (IQ1) | 37.3% | 45.2% |
| Interquartile 75% (IQ3) | 45.4% | 58.9% |
| Interquartile Range (IQR) | 8.2% | 13.8% |
| Standard Deviation (Sample) | 9.3% | 10.2% |
| Standard Deviation (Population) | 9.2% | 10.2% |
Similar Demographics by Currently Married
Demographics Similar to Immigrants from Liberia by Currently Married
In terms of currently married, the demographic groups most similar to Immigrants from Liberia are Immigrants from Belize (41.8%, a difference of 0.11%), African (41.8%, a difference of 0.15%), Immigrants from Guyana (41.9%, a difference of 0.29%), Immigrants from Trinidad and Tobago (41.9%, a difference of 0.30%), and Immigrants from Bahamas (41.9%, a difference of 0.33%).
| Demographics | Rating | Rank | Currently Married |
| Immigrants | Zaire | 0.0 /100 | #302 | Tragic 42.0% |
| Sioux | 0.0 /100 | #303 | Tragic 41.9% |
| Immigrants | Bahamas | 0.0 /100 | #304 | Tragic 41.9% |
| Immigrants | Trinidad and Tobago | 0.0 /100 | #305 | Tragic 41.9% |
| Immigrants | Guyana | 0.0 /100 | #306 | Tragic 41.9% |
| Africans | 0.0 /100 | #307 | Tragic 41.8% |
| Immigrants | Belize | 0.0 /100 | #308 | Tragic 41.8% |
| Immigrants | Liberia | 0.0 /100 | #309 | Tragic 41.8% |
| Guyanese | 0.0 /100 | #310 | Tragic 41.6% |
| Trinidadians and Tobagonians | 0.0 /100 | #311 | Tragic 41.5% |
| Somalis | 0.0 /100 | #312 | Tragic 41.5% |
| Jamaicans | 0.0 /100 | #313 | Tragic 41.4% |
| West Indians | 0.0 /100 | #314 | Tragic 41.3% |
| Inupiat | 0.0 /100 | #315 | Tragic 41.3% |
| Immigrants | Caribbean | 0.0 /100 | #316 | Tragic 41.3% |
Demographics Similar to Paraguayans by Currently Married
In terms of currently married, the demographic groups most similar to Paraguayans are Immigrants from Vietnam (47.2%, a difference of 0.020%), Pakistani (47.2%, a difference of 0.020%), Yugoslavian (47.2%, a difference of 0.020%), Immigrants from Norway (47.2%, a difference of 0.10%), and Cajun (47.1%, a difference of 0.13%).
| Demographics | Rating | Rank | Currently Married |
| Immigrants | Iraq | 82.8 /100 | #130 | Excellent 47.3% |
| Icelanders | 82.4 /100 | #131 | Excellent 47.3% |
| Afghans | 81.8 /100 | #132 | Excellent 47.3% |
| Immigrants | Malaysia | 81.1 /100 | #133 | Excellent 47.3% |
| Immigrants | Australia | 81.1 /100 | #134 | Excellent 47.3% |
| Immigrants | Norway | 79.7 /100 | #135 | Good 47.2% |
| Immigrants | Vietnam | 78.2 /100 | #136 | Good 47.2% |
| Paraguayans | 77.8 /100 | #137 | Good 47.2% |
| Pakistanis | 77.5 /100 | #138 | Good 47.2% |
| Yugoslavians | 77.4 /100 | #139 | Good 47.2% |
| Cajuns | 75.3 /100 | #140 | Good 47.1% |
| Venezuelans | 74.4 /100 | #141 | Good 47.1% |
| Argentineans | 74.4 /100 | #142 | Good 47.1% |
| Guamanians/Chamorros | 74.2 /100 | #143 | Good 47.1% |
| Hmong | 73.4 /100 | #144 | Good 47.1% |