Immigrants from Kuwait vs Chippewa Average Family Size
COMPARE
Immigrants from Kuwait
Chippewa
Average Family Size
Average Family Size Comparison
Immigrants from Kuwait
Chippewa
3.19
AVERAGE FAMILY SIZE
7.2/ 100
METRIC RATING
222nd/ 347
METRIC RANK
3.20
AVERAGE FAMILY SIZE
13.3/ 100
METRIC RATING
208th/ 347
METRIC RANK
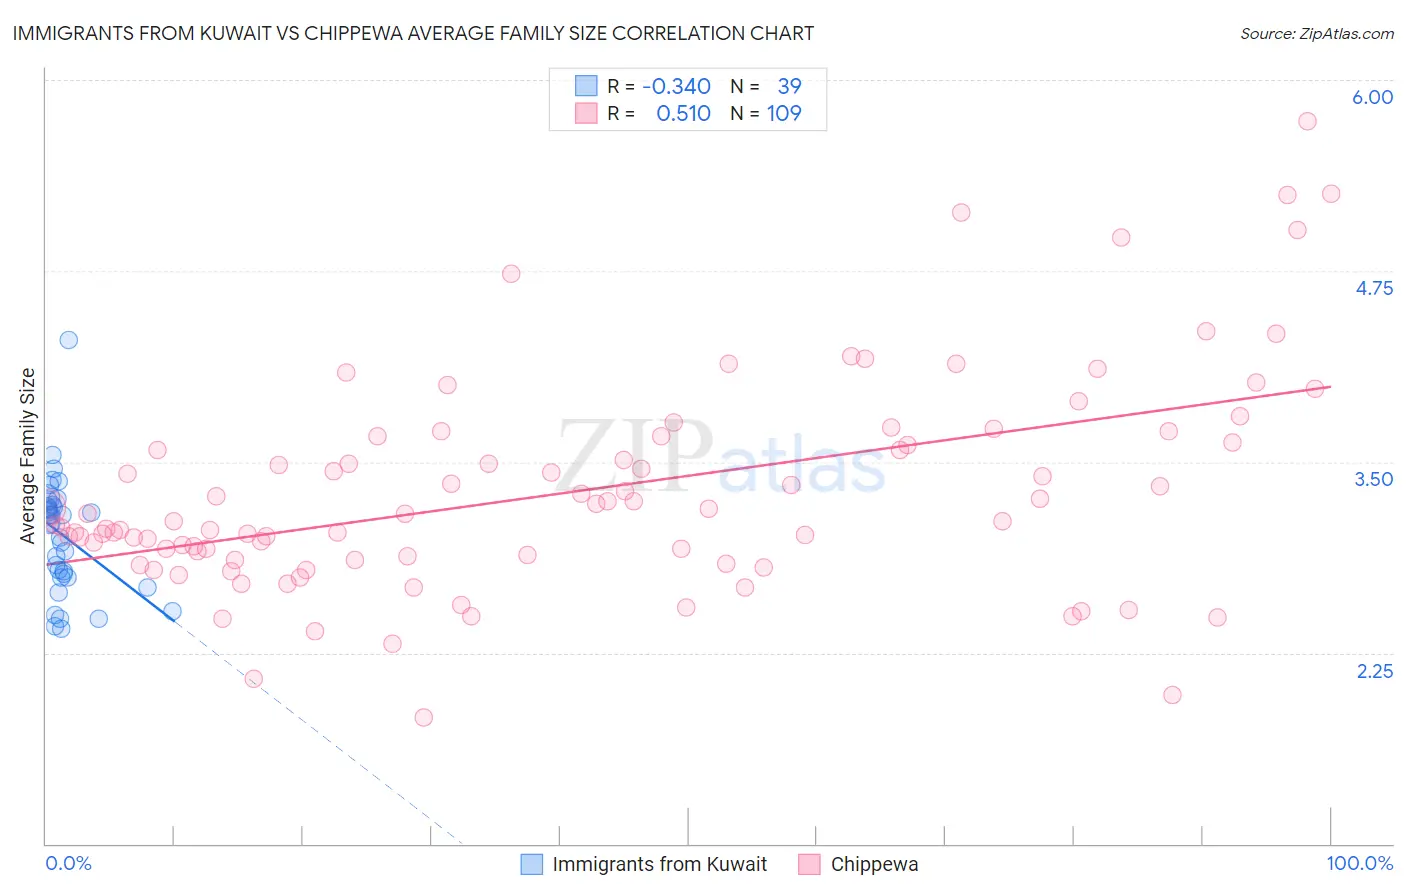
Immigrants from Kuwait vs Chippewa Average Family Size Correlation Chart
The statistical analysis conducted on geographies consisting of 136,887,006 people shows a mild negative correlation between the proportion of Immigrants from Kuwait and average family size in the United States with a correlation coefficient (R) of -0.340 and weighted average of 3.19. Similarly, the statistical analysis conducted on geographies consisting of 215,001,181 people shows a substantial positive correlation between the proportion of Chippewa and average family size in the United States with a correlation coefficient (R) of 0.510 and weighted average of 3.20, a difference of 0.32%.
Average Family Size Correlation Summary
| Measurement | Immigrants from Kuwait | Chippewa |
| Minimum | 2.41 | 1.83 |
| Maximum | 4.30 | 5.73 |
| Range | 1.89 | 3.90 |
| Mean | 3.02 | 3.30 |
| Median | 3.09 | 3.12 |
| Interquartile 25% (IQ1) | 2.74 | 2.87 |
| Interquartile 75% (IQ3) | 3.21 | 3.65 |
| Interquartile Range (IQR) | 0.47 | 0.78 |
| Standard Deviation (Sample) | 0.38 | 0.71 |
| Standard Deviation (Population) | 0.37 | 0.70 |
Demographics Similar to Immigrants from Kuwait and Chippewa by Average Family Size
In terms of average family size, the demographic groups most similar to Immigrants from Kuwait are Immigrants from Ukraine (3.19, a difference of 0.0%), Immigrants from Zimbabwe (3.19, a difference of 0.010%), Syrian (3.19, a difference of 0.050%), Cree (3.19, a difference of 0.070%), and Lebanese (3.19, a difference of 0.12%). Similarly, the demographic groups most similar to Chippewa are Sudanese (3.20, a difference of 0.0%), Filipino (3.20, a difference of 0.010%), Zimbabwean (3.20, a difference of 0.030%), Immigrants from Iran (3.20, a difference of 0.050%), and Creek (3.20, a difference of 0.050%).
| Demographics | Rating | Rank | Average Family Size |
| Paraguayans | 16.3 /100 | #205 | Poor 3.20 |
| Immigrants | Cabo Verde | 16.0 /100 | #206 | Poor 3.20 |
| Filipinos | 13.6 /100 | #207 | Poor 3.20 |
| Chippewa | 13.3 /100 | #208 | Poor 3.20 |
| Sudanese | 13.3 /100 | #209 | Poor 3.20 |
| Zimbabweans | 12.6 /100 | #210 | Poor 3.20 |
| Immigrants | Iran | 12.1 /100 | #211 | Poor 3.20 |
| Creek | 12.1 /100 | #212 | Poor 3.20 |
| Mongolians | 11.5 /100 | #213 | Poor 3.20 |
| Somalis | 11.2 /100 | #214 | Poor 3.20 |
| Delaware | 11.1 /100 | #215 | Poor 3.20 |
| Bermudans | 11.0 /100 | #216 | Poor 3.20 |
| Immigrants | Somalia | 10.3 /100 | #217 | Poor 3.20 |
| French American Indians | 9.8 /100 | #218 | Tragic 3.20 |
| Pennsylvania Germans | 9.3 /100 | #219 | Tragic 3.19 |
| Lebanese | 9.1 /100 | #220 | Tragic 3.19 |
| Immigrants | Ukraine | 7.2 /100 | #221 | Tragic 3.19 |
| Immigrants | Kuwait | 7.2 /100 | #222 | Tragic 3.19 |
| Immigrants | Zimbabwe | 7.1 /100 | #223 | Tragic 3.19 |
| Syrians | 6.5 /100 | #224 | Tragic 3.19 |
| Cree | 6.2 /100 | #225 | Tragic 3.19 |