Immigrants from Guatemala vs Senegalese Average Family Size

COMPARE

Immigrants from Guatemala
Race
Ancestry
AfghanAfricanAlaska NativeAlaskan AthabascanAlbanianAleutAlsatianAmericanApacheArabArapahoArgentineanArmenianAssyrian/Chaldean/SyriacAustralianAustrianBahamianBangladeshiBarbadianBasqueBelgianBelizeanBermudanBhutaneseBlackfeetBolivianBrazilianBritishBritish West IndianBulgarianBurmeseCajunCambodianCanadianCape VerdeanCarpatho RusynCelticCentral AmericanCentral American IndianCherokeeCheyenneChickasawChileanChineseChippewaChoctawColombianColvilleComancheCosta RicanCreeCreekCroatianCrowCubanCypriotCzechCzechoslovakianDanishDelawareDominicanDutchDutch West IndianEastern EuropeanEcuadorianEgyptianEnglishEstonianEthiopianEuropeanFijianFilipinoFinnishFrenchFrench American IndianFrench CanadianGermanGerman RussianGhanaianGreekGuamanian/ChamorroGuatemalanGuyaneseHaitianHmongHonduranHopiHoumaHungarianIcelanderIndian (Asian)IndonesianInupiatIranianIraqiIrishIroquoisIsraeliItalianJamaicanJapaneseJordanianKenyanKiowaKoreanLaotianLatvianLebaneseLiberianLithuanianLumbeeLuxembourgerMacedonianMalaysianMalteseMarshalleseMenomineeMexicanMexican American IndianMongolianMoroccanNative HawaiianNavajoNepaleseNew ZealanderNicaraguanNigerianNorthern EuropeanNorwegianOkinawanOsageOttawaPaiutePakistaniPalestinianPanamanianParaguayanPennsylvania GermanPeruvianPimaPolishPortuguesePotawatomiPuebloPuerto RicanPuget Sound SalishRomanianRussianSalvadoranSamoanScandinavianScotch-IrishScottishSeminoleSerbianShoshoneSierra LeoneanSiouxSlavicSlovakSloveneSomaliSouth AfricanSouth AmericanSouth American IndianSoviet UnionSpaniardSpanishSpanish AmericanSpanish American IndianSri LankanSubsaharan AfricanSudaneseSwedishSwissSyrianTaiwaneseThaiTlingit-HaidaTohono O'OdhamTonganTrinidadian and TobagonianTsimshianTurkishU.S. Virgin IslanderUgandanUkrainianUruguayanUteVenezuelanVietnameseWelshWest IndianYakamaYaquiYugoslavianYumanYup'ikZimbabwean
Immigration
NonimmigrantsImmigrantsAfghanistanAfricaAlbaniaArgentinaArmeniaAsiaAustraliaAustriaBahamasBangladeshBarbadosBelarusBelgiumBelizeBoliviaBosnia and HerzegovinaBrazilBulgariaBurma/MyanmarCabo VerdeCambodiaCameroonCanadaCaribbeanCentral AmericaChileChinaColombiaCongoCosta RicaCroatiaCubaCzechoslovakiaDenmarkDominicaDominican RepublicEastern AfricaEastern AsiaEastern EuropeEcuadorEgyptEl SalvadorEnglandEritreaEthiopiaEuropeFijiFranceGermanyGhanaGreeceGrenadaGuatemalaGuyanaHaitiHondurasHong KongHungaryIndiaIndonesiaIranIraqIrelandIsraelItalyJamaicaJapanJordanKazakhstanKenyaKoreaKuwaitLaosLatin AmericaLatviaLebanonLiberiaLithuaniaMalaysiaMexicoMicronesiaMiddle AfricaMoldovaMoroccoNepalNetherlandsNicaraguaNigeriaNorth AmericaNorth MacedoniaNorthern AfricaNorthern EuropeNorwayOceaniaPakistanPanamaPeruPhilippinesPolandPortugalRomaniaRussiaSaudi ArabiaScotlandSenegalSerbiaSierra LeoneSingaporeSomaliaSouth AfricaSouth AmericaSouth Central AsiaSouth Eastern AsiaSouthern EuropeSpainSri LankaSt. Vincent and the GrenadinesSudanSwedenSwitzerlandSyriaTaiwanThailandTrinidad and TobagoTurkeyUgandaUkraineUruguayUzbekistanVenezuelaVietnamWest IndiesWestern AfricaWestern AsiaWestern EuropeYemenZaireZimbabweAzores
Senegalese
Race
Ancestry
AfghanAfricanAlaska NativeAlaskan AthabascanAlbanianAleutAlsatianAmericanApacheArabArapahoArgentineanArmenianAssyrian/Chaldean/SyriacAustralianAustrianBahamianBangladeshiBarbadianBasqueBelgianBelizeanBermudanBhutaneseBlackfeetBolivianBrazilianBritishBritish West IndianBulgarianBurmeseCajunCambodianCanadianCape VerdeanCarpatho RusynCelticCentral AmericanCentral American IndianCherokeeCheyenneChickasawChileanChineseChippewaChoctawColombianColvilleComancheCosta RicanCreeCreekCroatianCrowCubanCypriotCzechCzechoslovakianDanishDelawareDominicanDutchDutch West IndianEastern EuropeanEcuadorianEgyptianEnglishEstonianEthiopianEuropeanFijianFilipinoFinnishFrenchFrench American IndianFrench CanadianGermanGerman RussianGhanaianGreekGuamanian/ChamorroGuatemalanGuyaneseHaitianHmongHonduranHopiHoumaHungarianIcelanderIndian (Asian)IndonesianInupiatIranianIraqiIrishIroquoisIsraeliItalianJamaicanJapaneseJordanianKenyanKiowaKoreanLaotianLatvianLebaneseLiberianLithuanianLumbeeLuxembourgerMacedonianMalaysianMalteseMarshalleseMenomineeMexicanMexican American IndianMongolianMoroccanNative HawaiianNavajoNepaleseNew ZealanderNicaraguanNigerianNorthern EuropeanNorwegianOkinawanOsageOttawaPaiutePakistaniPalestinianPanamanianParaguayanPennsylvania GermanPeruvianPimaPolishPortuguesePotawatomiPuebloPuerto RicanPuget Sound SalishRomanianRussianSalvadoranSamoanScandinavianScotch-IrishScottishSeminoleSenegaleseSerbianShoshoneSierra LeoneanSiouxSlavicSlovakSloveneSomaliSouth AfricanSouth AmericanSouth American IndianSoviet UnionSpaniardSpanishSpanish AmericanSpanish American IndianSri LankanSubsaharan AfricanSudaneseSwedishSwissSyrianTaiwaneseThaiTlingit-HaidaTohono O'OdhamTonganTrinidadian and TobagonianTsimshianTurkishU.S. Virgin IslanderUgandanUkrainianUruguayanUteVenezuelanVietnameseWelshWest IndianYakamaYaquiYugoslavianYumanYup'ikZimbabwean
Immigration
NonimmigrantsImmigrantsAfghanistanAfricaAlbaniaArgentinaArmeniaAsiaAustraliaAustriaBahamasBangladeshBarbadosBelarusBelgiumBelizeBoliviaBosnia and HerzegovinaBrazilBulgariaBurma/MyanmarCabo VerdeCambodiaCameroonCanadaCaribbeanCentral AmericaChileChinaColombiaCongoCosta RicaCroatiaCubaCzechoslovakiaDenmarkDominicaDominican RepublicEastern AfricaEastern AsiaEastern EuropeEcuadorEgyptEl SalvadorEnglandEritreaEthiopiaEuropeFijiFranceGermanyGhanaGreeceGrenadaGuyanaHaitiHondurasHong KongHungaryIndiaIndonesiaIranIraqIrelandIsraelItalyJamaicaJapanJordanKazakhstanKenyaKoreaKuwaitLaosLatin AmericaLatviaLebanonLiberiaLithuaniaMalaysiaMexicoMicronesiaMiddle AfricaMoldovaMoroccoNepalNetherlandsNicaraguaNigeriaNorth AmericaNorth MacedoniaNorthern AfricaNorthern EuropeNorwayOceaniaPakistanPanamaPeruPhilippinesPolandPortugalRomaniaRussiaSaudi ArabiaScotlandSenegalSerbiaSierra LeoneSingaporeSomaliaSouth AfricaSouth AmericaSouth Central AsiaSouth Eastern AsiaSouthern EuropeSpainSri LankaSt. Vincent and the GrenadinesSudanSwedenSwitzerlandSyriaTaiwanThailandTrinidad and TobagoTurkeyUgandaUkraineUruguayUzbekistanVenezuelaVietnamWest IndiesWestern AfricaWestern AsiaWestern EuropeYemenZaireZimbabweAzores
Average Family Size
Income
Poverty
Unemployment
Labor Participation
Family Structure
Vehicle Availability
Education Level
Disability

Average Family Size Comparison

Immigrants from Guatemala

Senegalese

Exceptional
Fair
3.41
AVERAGE FAMILY SIZE
100.0/ 100
METRIC RATING
32nd/ 347
METRIC RANK
3.21
AVERAGE FAMILY SIZE
28.2/ 100
METRIC RATING
196th/ 347
METRIC RANK

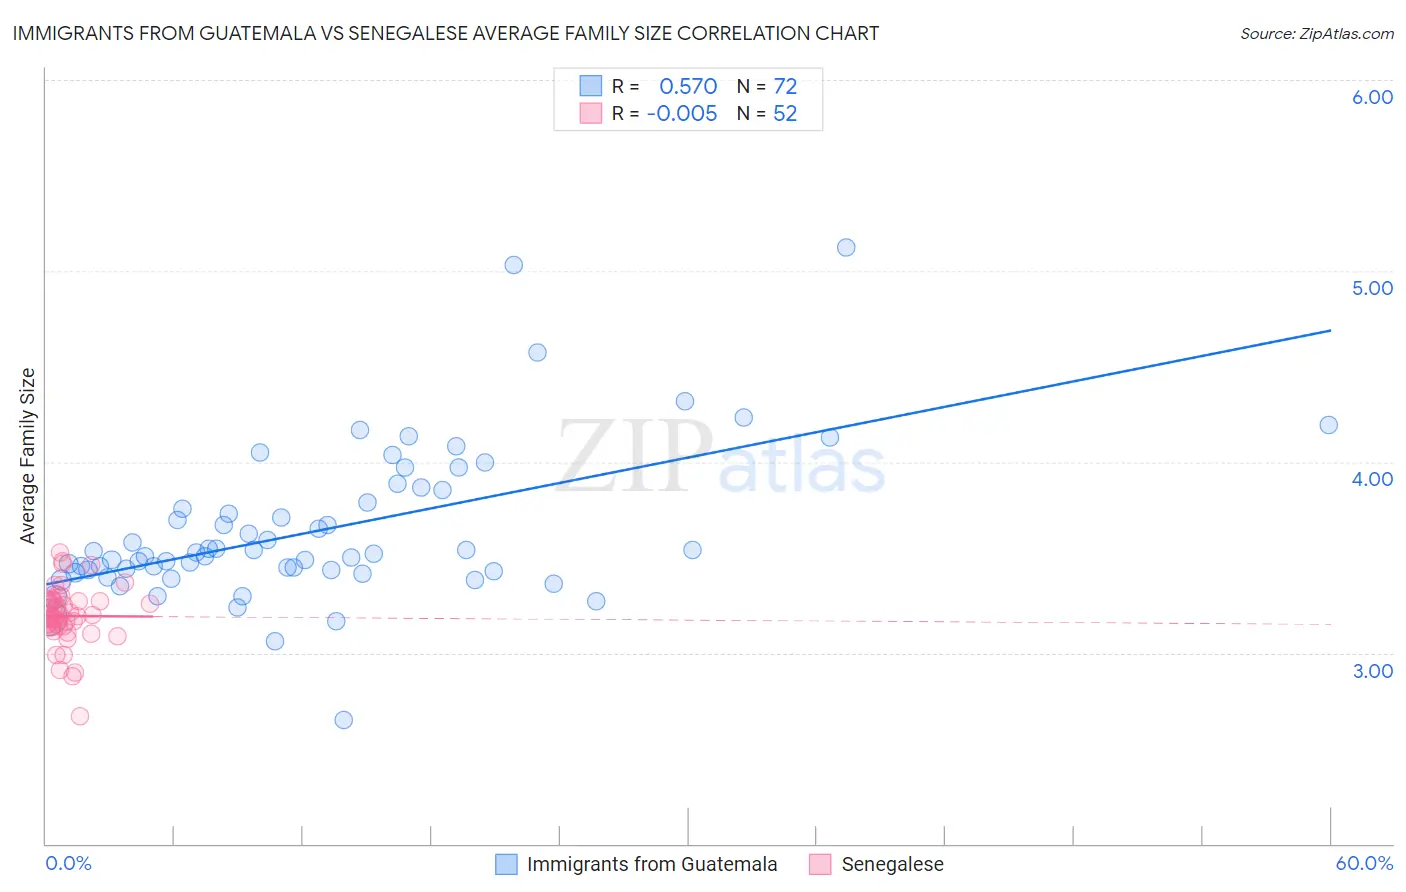
Immigrants from Guatemala vs Senegalese Average Family Size Correlation Chart

The statistical analysis conducted on geographies consisting of 377,174,912 people shows a substantial positive correlation between the proportion of Immigrants from Guatemala and average family size in the United States with a correlation coefficient (R) of 0.570 and weighted average of 3.41. Similarly, the statistical analysis conducted on geographies consisting of 78,113,781 people shows no correlation between the proportion of Senegalese and average family size in the United States with a correlation coefficient (R) of -0.005 and weighted average of 3.21, a difference of 6.1%.
Immigrants from Guatemala vs Senegalese Average Family Size

Average Family Size Correlation Summary

MeasurementImmigrants from GuatemalaSenegalese
Minimum2.652.67
Maximum5.123.53
Range2.470.86
Mean3.643.19
Median3.523.19
Interquartile 25% (IQ1)3.433.14
Interquartile 75% (IQ3)3.823.27
Interquartile Range (IQR)0.390.13
Standard Deviation (Sample)0.400.15
Standard Deviation (Population)0.400.15

Similar Demographics by Average Family Size

Demographics Similar to Immigrants from Guatemala by Average Family Size

In terms of average family size, the demographic groups most similar to Immigrants from Guatemala are Hawaiian (3.41, a difference of 0.030%), Hispanic or Latino (3.41, a difference of 0.080%), Central American (3.41, a difference of 0.10%), Guatemalan (3.40, a difference of 0.14%), and Immigrants from Guyana (3.40, a difference of 0.19%).
DemographicsRating | RankAverage Family Size
Yakama
100.0
/100
|
#25
Exceptional
3.45
Native Hawaiians
100.0
/100
|
#26
Exceptional
3.43
Mexican American Indians
100.0
/100
|
#27
Exceptional
3.43
Immigrants | Latin America
100.0
/100
|
#28
Exceptional
3.42
Nepalese
100.0
/100
|
#29
Exceptional
3.42
Samoans
100.0
/100
|
#30
Exceptional
3.42
Central Americans
100.0
/100
|
#31
Exceptional
3.41
Immigrants | Guatemala
100.0
/100
|
#32
Exceptional
3.41
Hawaiians
100.0
/100
|
#33
Exceptional
3.41
Hispanics or Latinos
100.0
/100
|
#34
Exceptional
3.41
Guatemalans
100.0
/100
|
#35
Exceptional
3.40
Immigrants | Guyana
100.0
/100
|
#36
Exceptional
3.40
Guyanese
100.0
/100
|
#37
Exceptional
3.40
Immigrants | Belize
100.0
/100
|
#38
Exceptional
3.39
Immigrants | Haiti
100.0
/100
|
#39
Exceptional
3.39

Demographics Similar to Senegalese by Average Family Size

In terms of average family size, the demographic groups most similar to Senegalese are Choctaw (3.21, a difference of 0.0%), Kenyan (3.21, a difference of 0.0%), Immigrants from Israel (3.22, a difference of 0.020%), Immigrants from Sudan (3.22, a difference of 0.020%), and Immigrants from Eastern Africa (3.22, a difference of 0.040%).
DemographicsRating | RankAverage Family Size
Pakistanis
33.7
/100
|
#189
Fair
3.22
Burmese
31.0
/100
|
#190
Fair
3.22
Immigrants | Zaire
30.5
/100
|
#191
Fair
3.22
Immigrants | Eastern Africa
30.1
/100
|
#192
Fair
3.22
Immigrants | Israel
29.3
/100
|
#193
Fair
3.22
Immigrants | Sudan
29.1
/100
|
#194
Fair
3.22
Choctaw
28.3
/100
|
#195
Fair
3.21
Senegalese
28.2
/100
|
#196
Fair
3.21
Kenyans
28.0
/100
|
#197
Fair
3.21
Immigrants | Azores
21.7
/100
|
#198
Fair
3.21
Hmong
20.7
/100
|
#199
Fair
3.21
Immigrants | Kenya
19.2
/100
|
#200
Poor
3.21
Immigrants | Morocco
18.5
/100
|
#201
Poor
3.21
Immigrants | India
18.5
/100
|
#202
Poor
3.21
Immigrants | Nepal
18.1
/100
|
#203
Poor
3.21