Immigrants from Europe vs Immigrants from Iraq Average Family Size
COMPARE
Immigrants from Europe
Immigrants from Iraq
Average Family Size
Average Family Size Comparison
Immigrants from Europe
Immigrants from Iraq
3.15
AVERAGE FAMILY SIZE
0.5/ 100
METRIC RATING
279th/ 347
METRIC RANK
3.24
AVERAGE FAMILY SIZE
63.7/ 100
METRIC RATING
160th/ 347
METRIC RANK
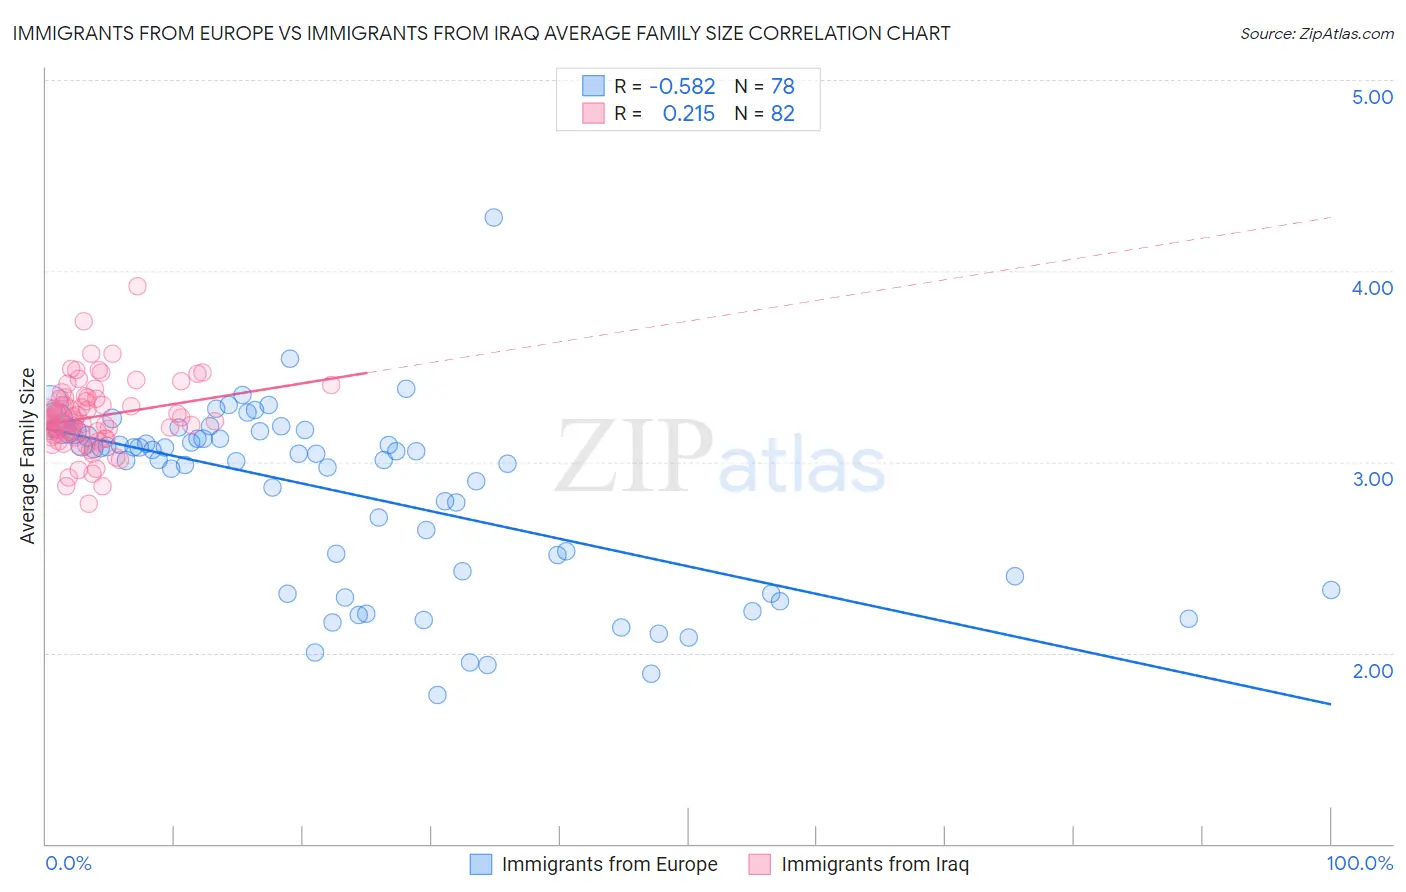
Immigrants from Europe vs Immigrants from Iraq Average Family Size Correlation Chart
The statistical analysis conducted on geographies consisting of 546,902,968 people shows a substantial negative correlation between the proportion of Immigrants from Europe and average family size in the United States with a correlation coefficient (R) of -0.582 and weighted average of 3.15. Similarly, the statistical analysis conducted on geographies consisting of 194,698,234 people shows a weak positive correlation between the proportion of Immigrants from Iraq and average family size in the United States with a correlation coefficient (R) of 0.215 and weighted average of 3.24, a difference of 2.8%.
Average Family Size Correlation Summary
| Measurement | Immigrants from Europe | Immigrants from Iraq |
| Minimum | 1.78 | 2.78 |
| Maximum | 4.28 | 3.92 |
| Range | 2.50 | 1.14 |
| Mean | 2.84 | 3.24 |
| Median | 3.04 | 3.21 |
| Interquartile 25% (IQ1) | 2.40 | 3.13 |
| Interquartile 75% (IQ3) | 3.16 | 3.33 |
| Interquartile Range (IQR) | 0.76 | 0.20 |
| Standard Deviation (Sample) | 0.48 | 0.19 |
| Standard Deviation (Population) | 0.47 | 0.18 |
Similar Demographics by Average Family Size
Demographics Similar to Immigrants from Europe by Average Family Size
In terms of average family size, the demographic groups most similar to Immigrants from Europe are Okinawan (3.15, a difference of 0.020%), Immigrants from England (3.15, a difference of 0.030%), Swiss (3.15, a difference of 0.040%), Immigrants from Bosnia and Herzegovina (3.15, a difference of 0.060%), and Immigrants from Denmark (3.15, a difference of 0.060%).
| Demographics | Rating | Rank | Average Family Size |
| Immigrants | Lithuania | 0.6 /100 | #272 | Tragic 3.15 |
| New Zealanders | 0.6 /100 | #273 | Tragic 3.15 |
| Immigrants | Belgium | 0.6 /100 | #274 | Tragic 3.15 |
| Cambodians | 0.6 /100 | #275 | Tragic 3.15 |
| Immigrants | Bosnia and Herzegovina | 0.5 /100 | #276 | Tragic 3.15 |
| Swiss | 0.5 /100 | #277 | Tragic 3.15 |
| Okinawans | 0.5 /100 | #278 | Tragic 3.15 |
| Immigrants | Europe | 0.5 /100 | #279 | Tragic 3.15 |
| Immigrants | England | 0.4 /100 | #280 | Tragic 3.15 |
| Immigrants | Denmark | 0.4 /100 | #281 | Tragic 3.15 |
| Yugoslavians | 0.4 /100 | #282 | Tragic 3.15 |
| German Russians | 0.4 /100 | #283 | Tragic 3.15 |
| Immigrants | France | 0.4 /100 | #284 | Tragic 3.15 |
| Whites/Caucasians | 0.3 /100 | #285 | Tragic 3.14 |
| Immigrants | Netherlands | 0.3 /100 | #286 | Tragic 3.14 |
Demographics Similar to Immigrants from Iraq by Average Family Size
In terms of average family size, the demographic groups most similar to Immigrants from Iraq are Iraqi (3.24, a difference of 0.010%), Ethiopian (3.24, a difference of 0.010%), Immigrants from Chile (3.24, a difference of 0.010%), Immigrants from Uzbekistan (3.24, a difference of 0.070%), and Immigrants from Uganda (3.23, a difference of 0.070%).
| Demographics | Rating | Rank | Average Family Size |
| Immigrants | Eritrea | 71.4 /100 | #153 | Good 3.24 |
| Immigrants | Egypt | 70.0 /100 | #154 | Good 3.24 |
| Seminole | 68.2 /100 | #155 | Good 3.24 |
| Immigrants | Taiwan | 68.1 /100 | #156 | Good 3.24 |
| Immigrants | Uzbekistan | 67.0 /100 | #157 | Good 3.24 |
| Iraqis | 64.3 /100 | #158 | Good 3.24 |
| Ethiopians | 63.9 /100 | #159 | Good 3.24 |
| Immigrants | Iraq | 63.7 /100 | #160 | Good 3.24 |
| Immigrants | Chile | 63.2 /100 | #161 | Good 3.24 |
| Immigrants | Uganda | 60.1 /100 | #162 | Good 3.23 |
| Uruguayans | 58.8 /100 | #163 | Average 3.23 |
| Egyptians | 58.6 /100 | #164 | Average 3.23 |
| Ugandans | 58.4 /100 | #165 | Average 3.23 |
| Immigrants | Senegal | 57.5 /100 | #166 | Average 3.23 |
| Dutch West Indians | 56.9 /100 | #167 | Average 3.23 |