Immigrants from El Salvador vs English Single Mother Households
COMPARE
Immigrants from El Salvador
English
Single Mother Households
Single Mother Households Comparison
Immigrants from El Salvador
English
7.6%
SINGLE MOTHER HOUSEHOLDS
0.0/ 100
METRIC RATING
279th/ 347
METRIC RANK
5.8%
SINGLE MOTHER HOUSEHOLDS
96.2/ 100
METRIC RATING
102nd/ 347
METRIC RANK
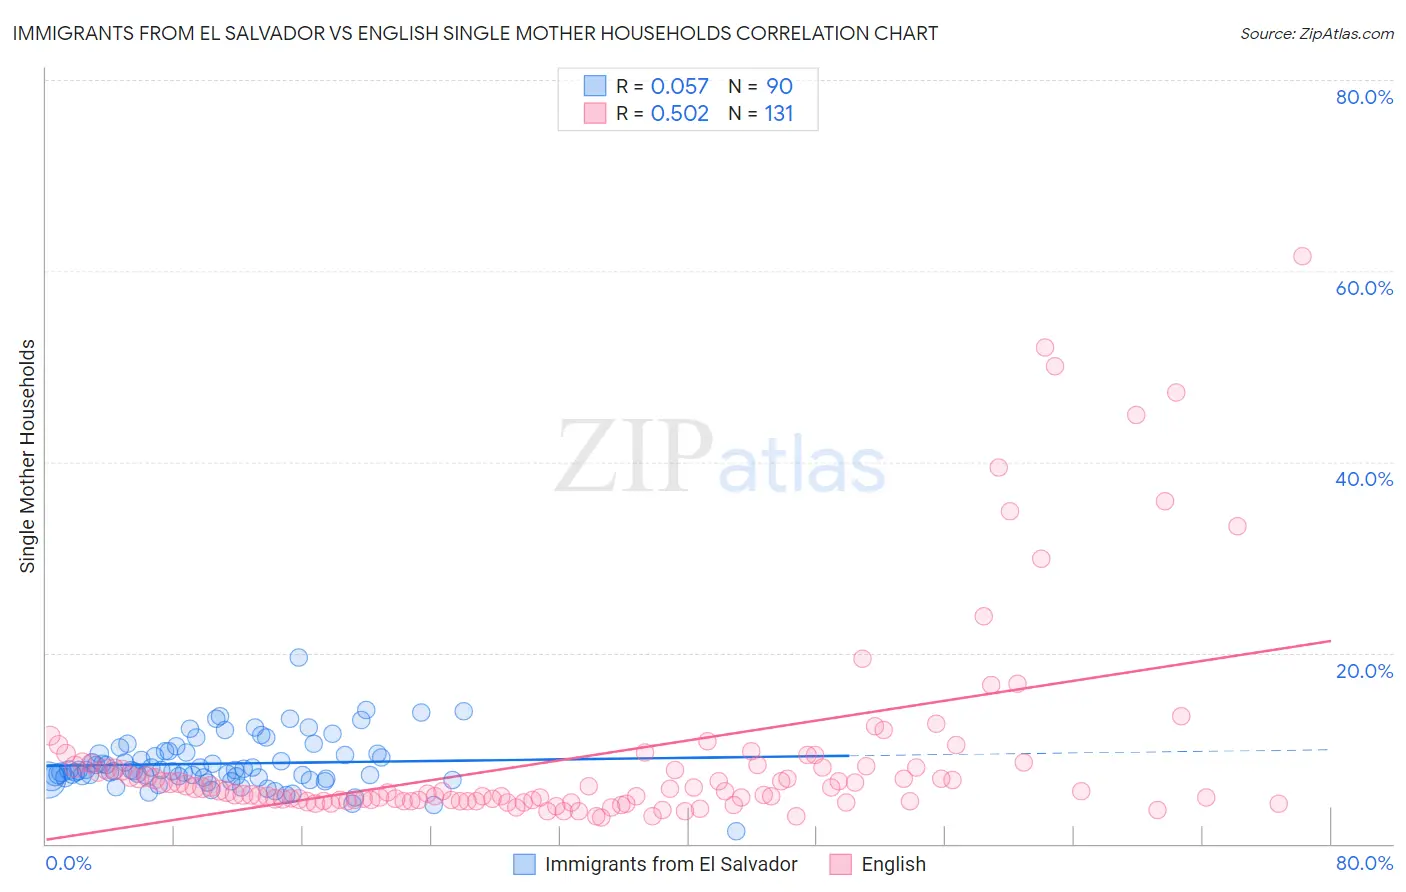
Immigrants from El Salvador vs English Single Mother Households Correlation Chart
The statistical analysis conducted on geographies consisting of 357,280,524 people shows a slight positive correlation between the proportion of Immigrants from El Salvador and percentage of single mother households in the United States with a correlation coefficient (R) of 0.057 and weighted average of 7.6%. Similarly, the statistical analysis conducted on geographies consisting of 572,865,481 people shows a substantial positive correlation between the proportion of English and percentage of single mother households in the United States with a correlation coefficient (R) of 0.502 and weighted average of 5.8%, a difference of 32.5%.
Single Mother Households Correlation Summary
| Measurement | Immigrants from El Salvador | English |
| Minimum | 1.3% | 2.8% |
| Maximum | 19.4% | 61.5% |
| Range | 18.2% | 58.8% |
| Mean | 8.4% | 9.2% |
| Median | 7.7% | 5.5% |
| Interquartile 25% (IQ1) | 6.9% | 4.5% |
| Interquartile 75% (IQ3) | 9.5% | 8.1% |
| Interquartile Range (IQR) | 2.6% | 3.6% |
| Standard Deviation (Sample) | 2.7% | 10.6% |
| Standard Deviation (Population) | 2.7% | 10.5% |
Similar Demographics by Single Mother Households
Demographics Similar to Immigrants from El Salvador by Single Mother Households
In terms of single mother households, the demographic groups most similar to Immigrants from El Salvador are Central American (7.6%, a difference of 0.22%), Immigrants from Trinidad and Tobago (7.6%, a difference of 0.23%), Guyanese (7.6%, a difference of 0.27%), Immigrants from Sierra Leone (7.7%, a difference of 0.52%), and Immigrants from Laos (7.7%, a difference of 0.52%).
| Demographics | Rating | Rank | Single Mother Households |
| Immigrants | Azores | 0.1 /100 | #272 | Tragic 7.5% |
| Belizeans | 0.1 /100 | #273 | Tragic 7.6% |
| Immigrants | Guyana | 0.1 /100 | #274 | Tragic 7.6% |
| Central American Indians | 0.1 /100 | #275 | Tragic 7.6% |
| Guyanese | 0.1 /100 | #276 | Tragic 7.6% |
| Immigrants | Trinidad and Tobago | 0.1 /100 | #277 | Tragic 7.6% |
| Central Americans | 0.1 /100 | #278 | Tragic 7.6% |
| Immigrants | El Salvador | 0.0 /100 | #279 | Tragic 7.6% |
| Immigrants | Sierra Leone | 0.0 /100 | #280 | Tragic 7.7% |
| Immigrants | Laos | 0.0 /100 | #281 | Tragic 7.7% |
| Guatemalans | 0.0 /100 | #282 | Tragic 7.7% |
| Nigerians | 0.0 /100 | #283 | Tragic 7.7% |
| Immigrants | Belize | 0.0 /100 | #284 | Tragic 7.7% |
| Trinidadians and Tobagonians | 0.0 /100 | #285 | Tragic 7.7% |
| Immigrants | Middle Africa | 0.0 /100 | #286 | Tragic 7.7% |
Demographics Similar to English by Single Mother Households
In terms of single mother households, the demographic groups most similar to English are German (5.8%, a difference of 0.0%), Scottish (5.8%, a difference of 0.020%), Northern European (5.8%, a difference of 0.020%), Scandinavian (5.8%, a difference of 0.030%), and Immigrants from Poland (5.8%, a difference of 0.050%).
| Demographics | Rating | Rank | Single Mother Households |
| Slovaks | 96.6 /100 | #95 | Exceptional 5.7% |
| Austrians | 96.4 /100 | #96 | Exceptional 5.7% |
| Tlingit-Haida | 96.4 /100 | #97 | Exceptional 5.7% |
| Immigrants | South Africa | 96.3 /100 | #98 | Exceptional 5.7% |
| Immigrants | Poland | 96.3 /100 | #99 | Exceptional 5.8% |
| Scandinavians | 96.2 /100 | #100 | Exceptional 5.8% |
| Germans | 96.2 /100 | #101 | Exceptional 5.8% |
| English | 96.2 /100 | #102 | Exceptional 5.8% |
| Scottish | 96.2 /100 | #103 | Exceptional 5.8% |
| Northern Europeans | 96.2 /100 | #104 | Exceptional 5.8% |
| Taiwanese | 96.1 /100 | #105 | Exceptional 5.8% |
| Immigrants | Ukraine | 95.9 /100 | #106 | Exceptional 5.8% |
| Paraguayans | 95.8 /100 | #107 | Exceptional 5.8% |
| Immigrants | Italy | 95.8 /100 | #108 | Exceptional 5.8% |
| Immigrants | Western Europe | 95.7 /100 | #109 | Exceptional 5.8% |