Immigrants from Ecuador vs Immigrants from Korea Average Family Size
COMPARE
Immigrants from Ecuador
Immigrants from Korea
Average Family Size
Average Family Size Comparison
Immigrants from Ecuador
Immigrants from Korea
3.32
AVERAGE FAMILY SIZE
99.8/ 100
METRIC RATING
77th/ 347
METRIC RANK
3.23
AVERAGE FAMILY SIZE
46.9/ 100
METRIC RATING
179th/ 347
METRIC RANK
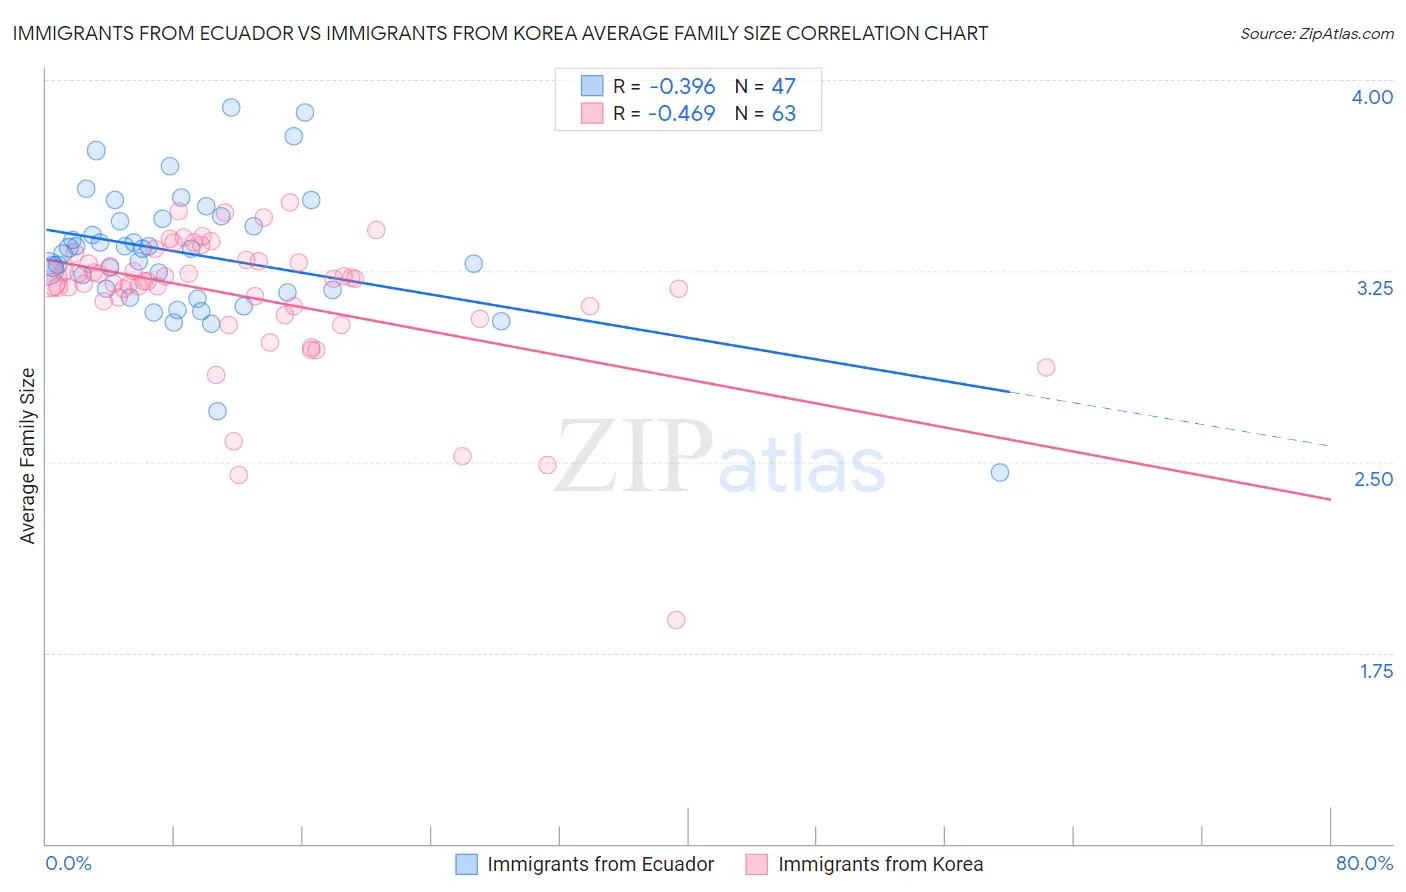
Immigrants from Ecuador vs Immigrants from Korea Average Family Size Correlation Chart
The statistical analysis conducted on geographies consisting of 270,888,675 people shows a mild negative correlation between the proportion of Immigrants from Ecuador and average family size in the United States with a correlation coefficient (R) of -0.396 and weighted average of 3.32. Similarly, the statistical analysis conducted on geographies consisting of 415,975,423 people shows a moderate negative correlation between the proportion of Immigrants from Korea and average family size in the United States with a correlation coefficient (R) of -0.469 and weighted average of 3.23, a difference of 3.0%.
Average Family Size Correlation Summary
| Measurement | Immigrants from Ecuador | Immigrants from Korea |
| Minimum | 2.46 | 1.88 |
| Maximum | 3.89 | 3.52 |
| Range | 1.43 | 1.64 |
| Mean | 3.32 | 3.15 |
| Median | 3.34 | 3.21 |
| Interquartile 25% (IQ1) | 3.17 | 3.11 |
| Interquartile 75% (IQ3) | 3.46 | 3.29 |
| Interquartile Range (IQR) | 0.29 | 0.18 |
| Standard Deviation (Sample) | 0.26 | 0.28 |
| Standard Deviation (Population) | 0.26 | 0.27 |
Similar Demographics by Average Family Size
Demographics Similar to Immigrants from Ecuador by Average Family Size
In terms of average family size, the demographic groups most similar to Immigrants from Ecuador are Trinidadian and Tobagonian (3.32, a difference of 0.010%), Immigrants from Barbados (3.32, a difference of 0.030%), Immigrants from Micronesia (3.32, a difference of 0.040%), British West Indian (3.32, a difference of 0.050%), and Immigrants from Sierra Leone (3.32, a difference of 0.060%).
| Demographics | Rating | Rank | Average Family Size |
| Immigrants | Trinidad and Tobago | 99.9 /100 | #70 | Exceptional 3.33 |
| Immigrants | West Indies | 99.9 /100 | #71 | Exceptional 3.33 |
| Immigrants | Caribbean | 99.9 /100 | #72 | Exceptional 3.33 |
| Yaqui | 99.9 /100 | #73 | Exceptional 3.32 |
| Immigrants | Sierra Leone | 99.9 /100 | #74 | Exceptional 3.32 |
| Immigrants | Barbados | 99.8 /100 | #75 | Exceptional 3.32 |
| Trinidadians and Tobagonians | 99.8 /100 | #76 | Exceptional 3.32 |
| Immigrants | Ecuador | 99.8 /100 | #77 | Exceptional 3.32 |
| Immigrants | Micronesia | 99.8 /100 | #78 | Exceptional 3.32 |
| British West Indians | 99.8 /100 | #79 | Exceptional 3.32 |
| Lumbee | 99.8 /100 | #80 | Exceptional 3.32 |
| Immigrants | Dominica | 99.8 /100 | #81 | Exceptional 3.32 |
| Ecuadorians | 99.8 /100 | #82 | Exceptional 3.32 |
| Immigrants | Afghanistan | 99.8 /100 | #83 | Exceptional 3.32 |
| Immigrants | Nigeria | 99.7 /100 | #84 | Exceptional 3.32 |
Demographics Similar to Immigrants from Korea by Average Family Size
In terms of average family size, the demographic groups most similar to Immigrants from Korea are Argentinean (3.23, a difference of 0.010%), Spaniard (3.23, a difference of 0.010%), Palestinian (3.23, a difference of 0.010%), Israeli (3.23, a difference of 0.030%), and Spanish (3.23, a difference of 0.040%).
| Demographics | Rating | Rank | Average Family Size |
| Immigrants | Congo | 52.7 /100 | #172 | Average 3.23 |
| Immigrants | Uruguay | 52.0 /100 | #173 | Average 3.23 |
| Immigrants | South Central Asia | 50.0 /100 | #174 | Average 3.23 |
| Immigrants | China | 49.9 /100 | #175 | Average 3.23 |
| Israelis | 48.7 /100 | #176 | Average 3.23 |
| Argentineans | 47.4 /100 | #177 | Average 3.23 |
| Spaniards | 47.2 /100 | #178 | Average 3.23 |
| Immigrants | Korea | 46.9 /100 | #179 | Average 3.23 |
| Palestinians | 46.6 /100 | #180 | Average 3.23 |
| Spanish | 44.8 /100 | #181 | Average 3.23 |
| Moroccans | 44.2 /100 | #182 | Average 3.22 |
| Immigrants | Northern Africa | 41.7 /100 | #183 | Average 3.22 |
| Immigrants | Eastern Asia | 40.8 /100 | #184 | Average 3.22 |
| Immigrants | Sri Lanka | 39.8 /100 | #185 | Fair 3.22 |
| Immigrants | Argentina | 39.8 /100 | #186 | Fair 3.22 |