Immigrants from Eastern Europe vs Lebanese Divorced or Separated
COMPARE
Immigrants from Eastern Europe
Lebanese
Divorced or Separated
Divorced or Separated Comparison
Immigrants from Eastern Europe
Lebanese
11.5%
DIVORCED OR SEPARATED
99.7/ 100
METRIC RATING
70th/ 347
METRIC RANK
11.9%
DIVORCED OR SEPARATED
83.4/ 100
METRIC RATING
140th/ 347
METRIC RANK
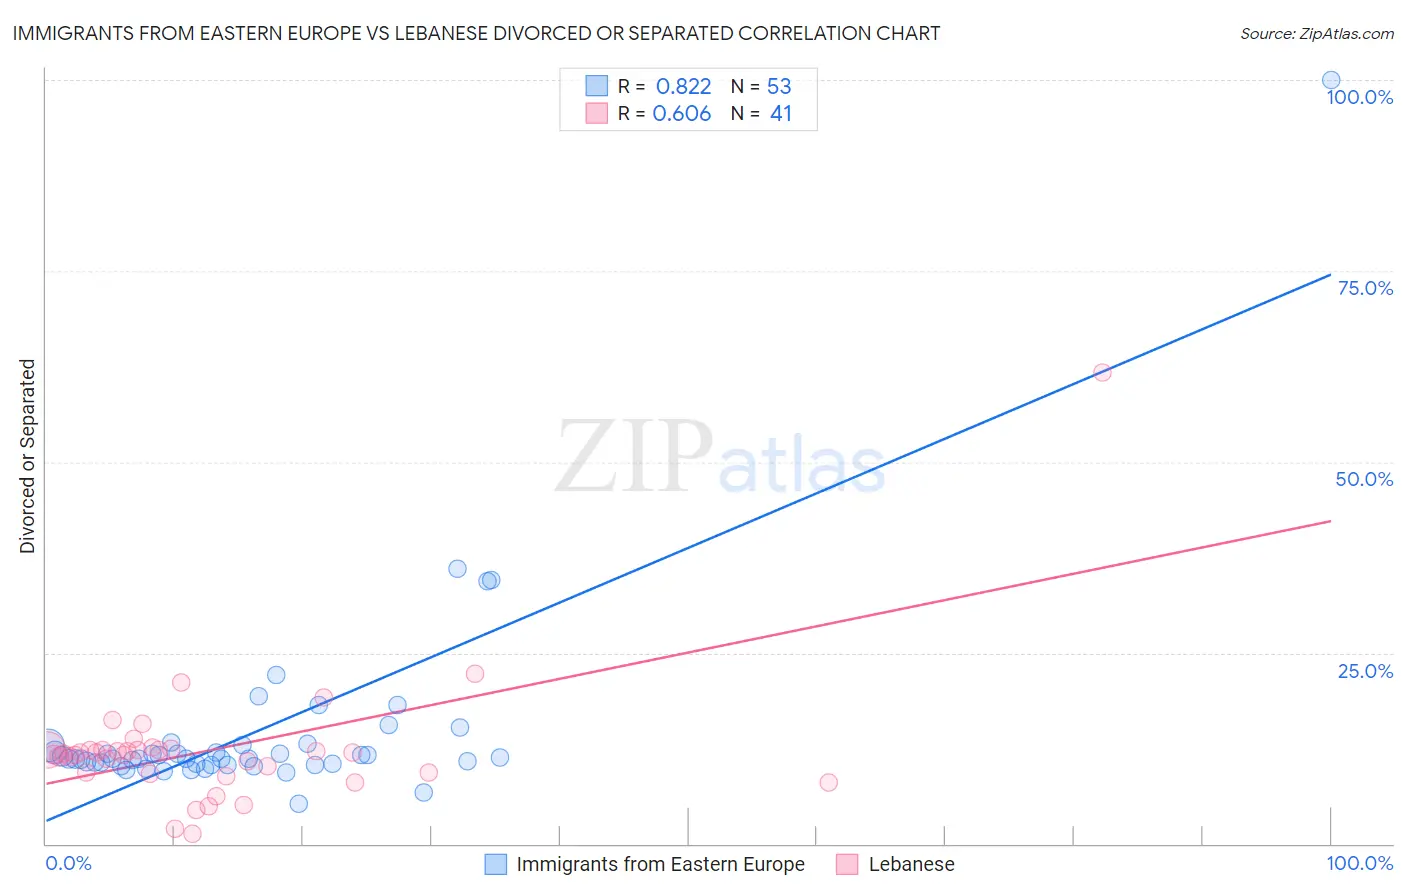
Immigrants from Eastern Europe vs Lebanese Divorced or Separated Correlation Chart
The statistical analysis conducted on geographies consisting of 475,622,511 people shows a very strong positive correlation between the proportion of Immigrants from Eastern Europe and percentage of population currently divorced or separated in the United States with a correlation coefficient (R) of 0.822 and weighted average of 11.5%. Similarly, the statistical analysis conducted on geographies consisting of 401,417,076 people shows a significant positive correlation between the proportion of Lebanese and percentage of population currently divorced or separated in the United States with a correlation coefficient (R) of 0.606 and weighted average of 11.9%, a difference of 3.8%.
Divorced or Separated Correlation Summary
| Measurement | Immigrants from Eastern Europe | Lebanese |
| Minimum | 5.2% | 1.3% |
| Maximum | 100.0% | 61.7% |
| Range | 94.8% | 60.4% |
| Mean | 14.7% | 12.4% |
| Median | 11.1% | 11.8% |
| Interquartile 25% (IQ1) | 10.4% | 9.2% |
| Interquartile 75% (IQ3) | 12.9% | 12.3% |
| Interquartile Range (IQR) | 2.4% | 3.1% |
| Standard Deviation (Sample) | 13.4% | 9.0% |
| Standard Deviation (Population) | 13.3% | 8.9% |
Similar Demographics by Divorced or Separated
Demographics Similar to Immigrants from Eastern Europe by Divorced or Separated
In terms of divorced or separated, the demographic groups most similar to Immigrants from Eastern Europe are Immigrants from Belgium (11.5%, a difference of 0.010%), Palestinian (11.5%, a difference of 0.020%), Paraguayan (11.5%, a difference of 0.10%), Immigrants from Syria (11.4%, a difference of 0.13%), and Jordanian (11.5%, a difference of 0.16%).
| Demographics | Rating | Rank | Divorced or Separated |
| Immigrants | Kuwait | 99.9 /100 | #63 | Exceptional 11.3% |
| Macedonians | 99.8 /100 | #64 | Exceptional 11.4% |
| Immigrants | South Eastern Asia | 99.8 /100 | #65 | Exceptional 11.4% |
| Inupiat | 99.8 /100 | #66 | Exceptional 11.4% |
| Immigrants | Syria | 99.7 /100 | #67 | Exceptional 11.4% |
| Palestinians | 99.7 /100 | #68 | Exceptional 11.5% |
| Immigrants | Belgium | 99.7 /100 | #69 | Exceptional 11.5% |
| Immigrants | Eastern Europe | 99.7 /100 | #70 | Exceptional 11.5% |
| Paraguayans | 99.7 /100 | #71 | Exceptional 11.5% |
| Jordanians | 99.6 /100 | #72 | Exceptional 11.5% |
| Immigrants | North Macedonia | 99.6 /100 | #73 | Exceptional 11.5% |
| Taiwanese | 99.6 /100 | #74 | Exceptional 11.5% |
| Immigrants | Northern Africa | 99.6 /100 | #75 | Exceptional 11.5% |
| Albanians | 99.6 /100 | #76 | Exceptional 11.5% |
| Immigrants | Italy | 99.5 /100 | #77 | Exceptional 11.5% |
Demographics Similar to Lebanese by Divorced or Separated
In terms of divorced or separated, the demographic groups most similar to Lebanese are Australian (11.9%, a difference of 0.020%), Immigrants from Netherlands (11.9%, a difference of 0.030%), Immigrants from Morocco (11.9%, a difference of 0.030%), Alsatian (11.9%, a difference of 0.040%), and Carpatho Rusyn (11.9%, a difference of 0.090%).
| Demographics | Rating | Rank | Divorced or Separated |
| New Zealanders | 87.5 /100 | #133 | Excellent 11.9% |
| Argentineans | 85.1 /100 | #134 | Excellent 11.9% |
| Danes | 84.8 /100 | #135 | Excellent 11.9% |
| Carpatho Rusyns | 84.8 /100 | #136 | Excellent 11.9% |
| Alsatians | 84.0 /100 | #137 | Excellent 11.9% |
| Immigrants | Netherlands | 83.9 /100 | #138 | Excellent 11.9% |
| Australians | 83.6 /100 | #139 | Excellent 11.9% |
| Lebanese | 83.4 /100 | #140 | Excellent 11.9% |
| Immigrants | Morocco | 82.9 /100 | #141 | Excellent 11.9% |
| Immigrants | Zimbabwe | 81.5 /100 | #142 | Excellent 11.9% |
| Pakistanis | 81.3 /100 | #143 | Excellent 11.9% |
| Peruvians | 80.9 /100 | #144 | Excellent 11.9% |
| Croatians | 80.6 /100 | #145 | Excellent 11.9% |
| Immigrants | Grenada | 79.1 /100 | #146 | Good 11.9% |
| Poles | 78.6 /100 | #147 | Good 11.9% |