Immigrants from Eastern Asia vs Immigrants from Kenya Births to Unmarried Women
COMPARE
Immigrants from Eastern Asia
Immigrants from Kenya
Births to Unmarried Women
Births to Unmarried Women Comparison
Immigrants from Eastern Asia
Immigrants from Kenya
25.0%
BIRTHS TO UNMARRIED WOMEN
100.0/ 100
METRIC RATING
10th/ 347
METRIC RANK
32.1%
BIRTHS TO UNMARRIED WOMEN
36.9/ 100
METRIC RATING
189th/ 347
METRIC RANK
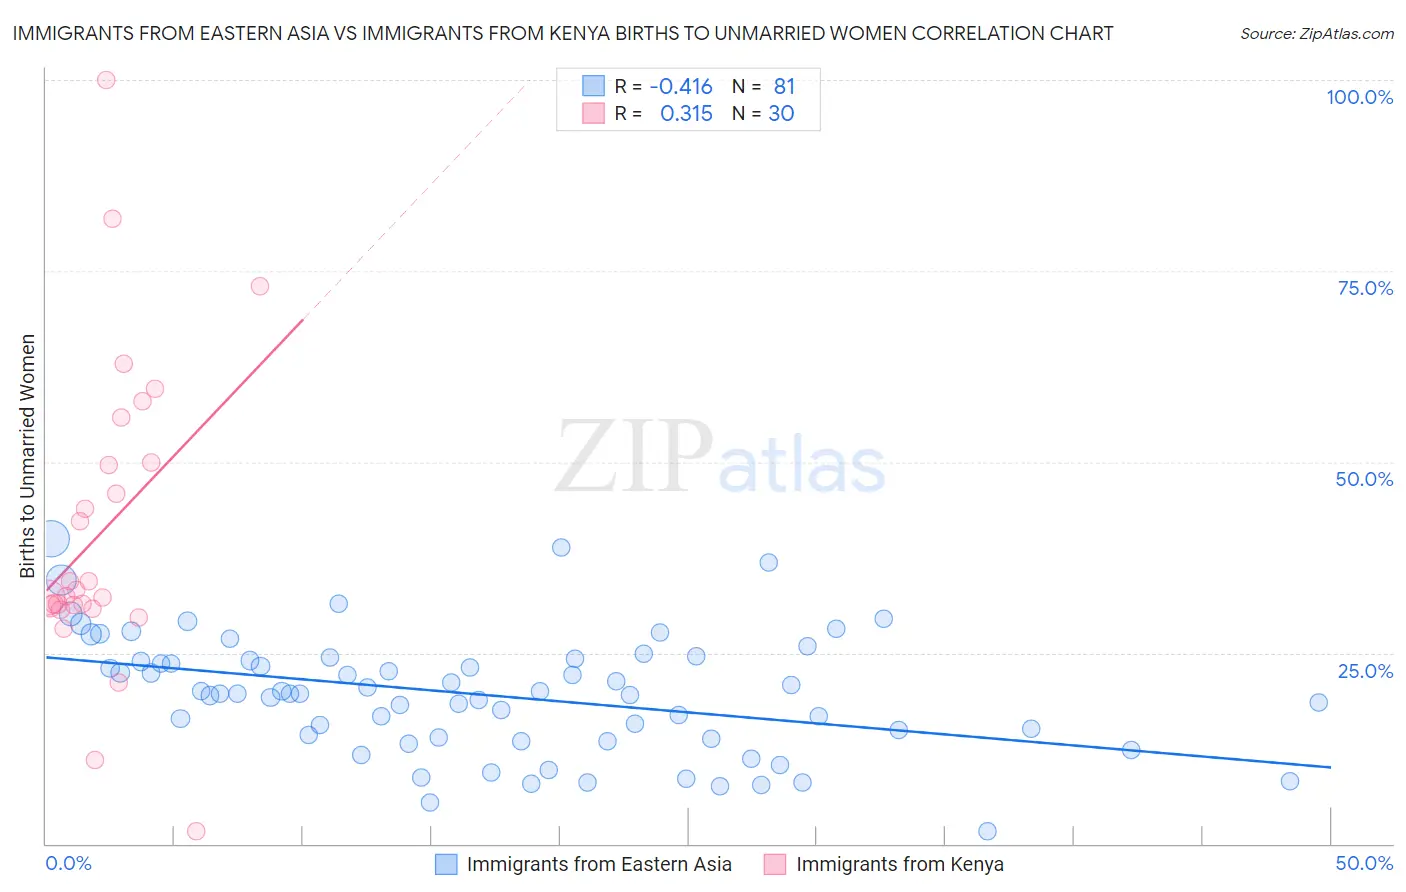
Immigrants from Eastern Asia vs Immigrants from Kenya Births to Unmarried Women Correlation Chart
The statistical analysis conducted on geographies consisting of 456,409,024 people shows a moderate negative correlation between the proportion of Immigrants from Eastern Asia and percentage of births to unmarried women in the United States with a correlation coefficient (R) of -0.416 and weighted average of 25.0%. Similarly, the statistical analysis conducted on geographies consisting of 210,061,001 people shows a mild positive correlation between the proportion of Immigrants from Kenya and percentage of births to unmarried women in the United States with a correlation coefficient (R) of 0.315 and weighted average of 32.1%, a difference of 28.1%.
Births to Unmarried Women Correlation Summary
| Measurement | Immigrants from Eastern Asia | Immigrants from Kenya |
| Minimum | 1.6% | 1.6% |
| Maximum | 39.9% | 100.0% |
| Range | 38.3% | 98.4% |
| Mean | 19.5% | 41.0% |
| Median | 19.7% | 32.8% |
| Interquartile 25% (IQ1) | 13.8% | 31.1% |
| Interquartile 75% (IQ3) | 24.1% | 50.0% |
| Interquartile Range (IQR) | 10.3% | 18.9% |
| Standard Deviation (Sample) | 7.8% | 20.2% |
| Standard Deviation (Population) | 7.8% | 19.9% |
Similar Demographics by Births to Unmarried Women
Demographics Similar to Immigrants from Eastern Asia by Births to Unmarried Women
In terms of births to unmarried women, the demographic groups most similar to Immigrants from Eastern Asia are Immigrants from Israel (25.1%, a difference of 0.42%), Indian (Asian) (25.3%, a difference of 0.90%), Iranian (25.3%, a difference of 1.0%), Immigrants from Lebanon (25.3%, a difference of 1.2%), and Immigrants from South Central Asia (24.7%, a difference of 1.5%).
| Demographics | Rating | Rank | Births to Unmarried Women |
| Filipinos | 100.0 /100 | #3 | Exceptional 23.0% |
| Immigrants | Taiwan | 100.0 /100 | #4 | Exceptional 23.0% |
| Immigrants | Hong Kong | 100.0 /100 | #5 | Exceptional 23.6% |
| Immigrants | Iran | 100.0 /100 | #6 | Exceptional 24.0% |
| Thais | 100.0 /100 | #7 | Exceptional 24.0% |
| Immigrants | China | 100.0 /100 | #8 | Exceptional 24.7% |
| Immigrants | South Central Asia | 100.0 /100 | #9 | Exceptional 24.7% |
| Immigrants | Eastern Asia | 100.0 /100 | #10 | Exceptional 25.0% |
| Immigrants | Israel | 100.0 /100 | #11 | Exceptional 25.1% |
| Indians (Asian) | 100.0 /100 | #12 | Exceptional 25.3% |
| Iranians | 100.0 /100 | #13 | Exceptional 25.3% |
| Immigrants | Lebanon | 100.0 /100 | #14 | Exceptional 25.3% |
| Immigrants | Singapore | 100.0 /100 | #15 | Exceptional 25.6% |
| Immigrants | Belarus | 100.0 /100 | #16 | Exceptional 25.6% |
| Immigrants | Uzbekistan | 100.0 /100 | #17 | Exceptional 25.8% |
Demographics Similar to Immigrants from Kenya by Births to Unmarried Women
In terms of births to unmarried women, the demographic groups most similar to Immigrants from Kenya are Osage (32.1%, a difference of 0.030%), Czechoslovakian (32.0%, a difference of 0.11%), Welsh (32.0%, a difference of 0.13%), German (32.0%, a difference of 0.26%), and Immigrants from South America (32.0%, a difference of 0.37%).
| Demographics | Rating | Rank | Births to Unmarried Women |
| Kenyans | 43.0 /100 | #182 | Average 31.9% |
| Canadians | 41.4 /100 | #183 | Average 31.9% |
| Immigrants | South America | 40.7 /100 | #184 | Average 32.0% |
| Germans | 39.5 /100 | #185 | Fair 32.0% |
| Welsh | 38.2 /100 | #186 | Fair 32.0% |
| Czechoslovakians | 38.0 /100 | #187 | Fair 32.0% |
| Osage | 37.1 /100 | #188 | Fair 32.1% |
| Immigrants | Kenya | 36.9 /100 | #189 | Fair 32.1% |
| Tlingit-Haida | 32.6 /100 | #190 | Fair 32.2% |
| Irish | 32.4 /100 | #191 | Fair 32.2% |
| Colombians | 31.9 /100 | #192 | Fair 32.2% |
| Fijians | 31.1 /100 | #193 | Fair 32.3% |
| Sudanese | 27.3 /100 | #194 | Fair 32.4% |
| Samoans | 21.9 /100 | #195 | Fair 32.6% |
| Immigrants | Colombia | 21.7 /100 | #196 | Fair 32.6% |