Immigrants from Denmark vs Kenyan Single Father Households
COMPARE
Immigrants from Denmark
Kenyan
Single Father Households
Single Father Households Comparison
Immigrants from Denmark
Kenyans
2.1%
SINGLE FATHER HOUSEHOLDS
99.8/ 100
METRIC RATING
68th/ 347
METRIC RANK
2.4%
SINGLE FATHER HOUSEHOLDS
28.0/ 100
METRIC RATING
196th/ 347
METRIC RANK
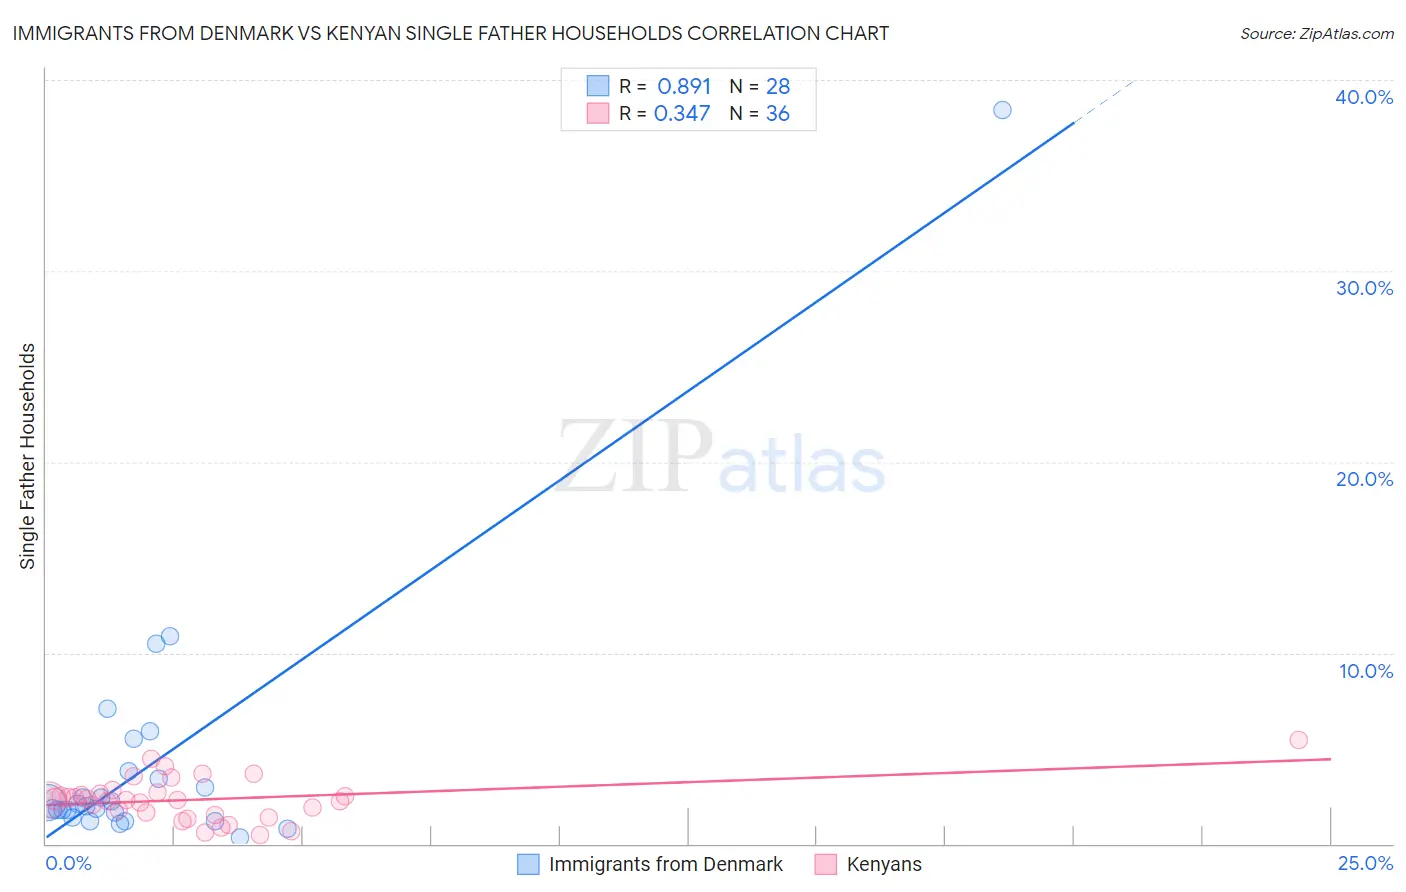
Immigrants from Denmark vs Kenyan Single Father Households Correlation Chart
The statistical analysis conducted on geographies consisting of 135,813,845 people shows a very strong positive correlation between the proportion of Immigrants from Denmark and percentage of single father households in the United States with a correlation coefficient (R) of 0.891 and weighted average of 2.1%. Similarly, the statistical analysis conducted on geographies consisting of 167,815,034 people shows a mild positive correlation between the proportion of Kenyans and percentage of single father households in the United States with a correlation coefficient (R) of 0.347 and weighted average of 2.4%, a difference of 15.3%.
Single Father Households Correlation Summary
| Measurement | Immigrants from Denmark | Kenyan |
| Minimum | 0.35% | 0.47% |
| Maximum | 38.5% | 5.4% |
| Range | 38.1% | 5.0% |
| Mean | 4.3% | 2.3% |
| Median | 2.0% | 2.3% |
| Interquartile 25% (IQ1) | 1.5% | 1.6% |
| Interquartile 75% (IQ3) | 3.6% | 2.7% |
| Interquartile Range (IQR) | 2.1% | 1.1% |
| Standard Deviation (Sample) | 7.2% | 1.1% |
| Standard Deviation (Population) | 7.1% | 1.1% |
Similar Demographics by Single Father Households
Demographics Similar to Immigrants from Denmark by Single Father Households
In terms of single father households, the demographic groups most similar to Immigrants from Denmark are Immigrants from Romania (2.1%, a difference of 0.020%), Immigrants from Italy (2.1%, a difference of 0.090%), Immigrants from Western Asia (2.1%, a difference of 0.14%), Egyptian (2.1%, a difference of 0.23%), and Immigrants from Kuwait (2.1%, a difference of 0.24%).
| Demographics | Rating | Rank | Single Father Households |
| Vietnamese | 99.9 /100 | #61 | Exceptional 2.0% |
| Immigrants | Malaysia | 99.9 /100 | #62 | Exceptional 2.0% |
| Maltese | 99.9 /100 | #63 | Exceptional 2.0% |
| Mongolians | 99.9 /100 | #64 | Exceptional 2.1% |
| Paraguayans | 99.9 /100 | #65 | Exceptional 2.1% |
| Immigrants | Western Asia | 99.8 /100 | #66 | Exceptional 2.1% |
| Immigrants | Italy | 99.8 /100 | #67 | Exceptional 2.1% |
| Immigrants | Denmark | 99.8 /100 | #68 | Exceptional 2.1% |
| Immigrants | Romania | 99.8 /100 | #69 | Exceptional 2.1% |
| Egyptians | 99.8 /100 | #70 | Exceptional 2.1% |
| Immigrants | Kuwait | 99.8 /100 | #71 | Exceptional 2.1% |
| Immigrants | Spain | 99.8 /100 | #72 | Exceptional 2.1% |
| Immigrants | Bangladesh | 99.8 /100 | #73 | Exceptional 2.1% |
| Immigrants | Egypt | 99.8 /100 | #74 | Exceptional 2.1% |
| Immigrants | Sweden | 99.8 /100 | #75 | Exceptional 2.1% |
Demographics Similar to Kenyans by Single Father Households
In terms of single father households, the demographic groups most similar to Kenyans are German (2.4%, a difference of 0.0%), Immigrants from Philippines (2.4%, a difference of 0.060%), Scandinavian (2.4%, a difference of 0.060%), Immigrants from Vietnam (2.4%, a difference of 0.080%), and Peruvian (2.4%, a difference of 0.090%).
| Demographics | Rating | Rank | Single Father Households |
| U.S. Virgin Islanders | 31.8 /100 | #189 | Fair 2.4% |
| French | 31.7 /100 | #190 | Fair 2.4% |
| Immigrants | Africa | 30.0 /100 | #191 | Fair 2.4% |
| Immigrants | Sudan | 29.8 /100 | #192 | Fair 2.4% |
| Uruguayans | 29.7 /100 | #193 | Fair 2.4% |
| Panamanians | 29.6 /100 | #194 | Fair 2.4% |
| Immigrants | Philippines | 28.7 /100 | #195 | Fair 2.4% |
| Kenyans | 28.0 /100 | #196 | Fair 2.4% |
| Germans | 28.0 /100 | #197 | Fair 2.4% |
| Scandinavians | 27.4 /100 | #198 | Fair 2.4% |
| Immigrants | Vietnam | 27.1 /100 | #199 | Fair 2.4% |
| Peruvians | 27.1 /100 | #200 | Fair 2.4% |
| Immigrants | Uganda | 26.0 /100 | #201 | Fair 2.4% |
| German Russians | 25.7 /100 | #202 | Fair 2.4% |
| French Canadians | 24.7 /100 | #203 | Fair 2.4% |