Immigrants from Austria vs Immigrants from Dominica Family Households with Children
COMPARE
Immigrants from Austria
Immigrants from Dominica
Family Households with Children
Family Households with Children Comparison
Immigrants from Austria
Immigrants from Dominica
25.8%
FAMILY HOUSEHOLDS WITH CHILDREN
0.0/ 100
METRIC RATING
332nd/ 347
METRIC RANK
27.2%
FAMILY HOUSEHOLDS WITH CHILDREN
13.9/ 100
METRIC RATING
212th/ 347
METRIC RANK
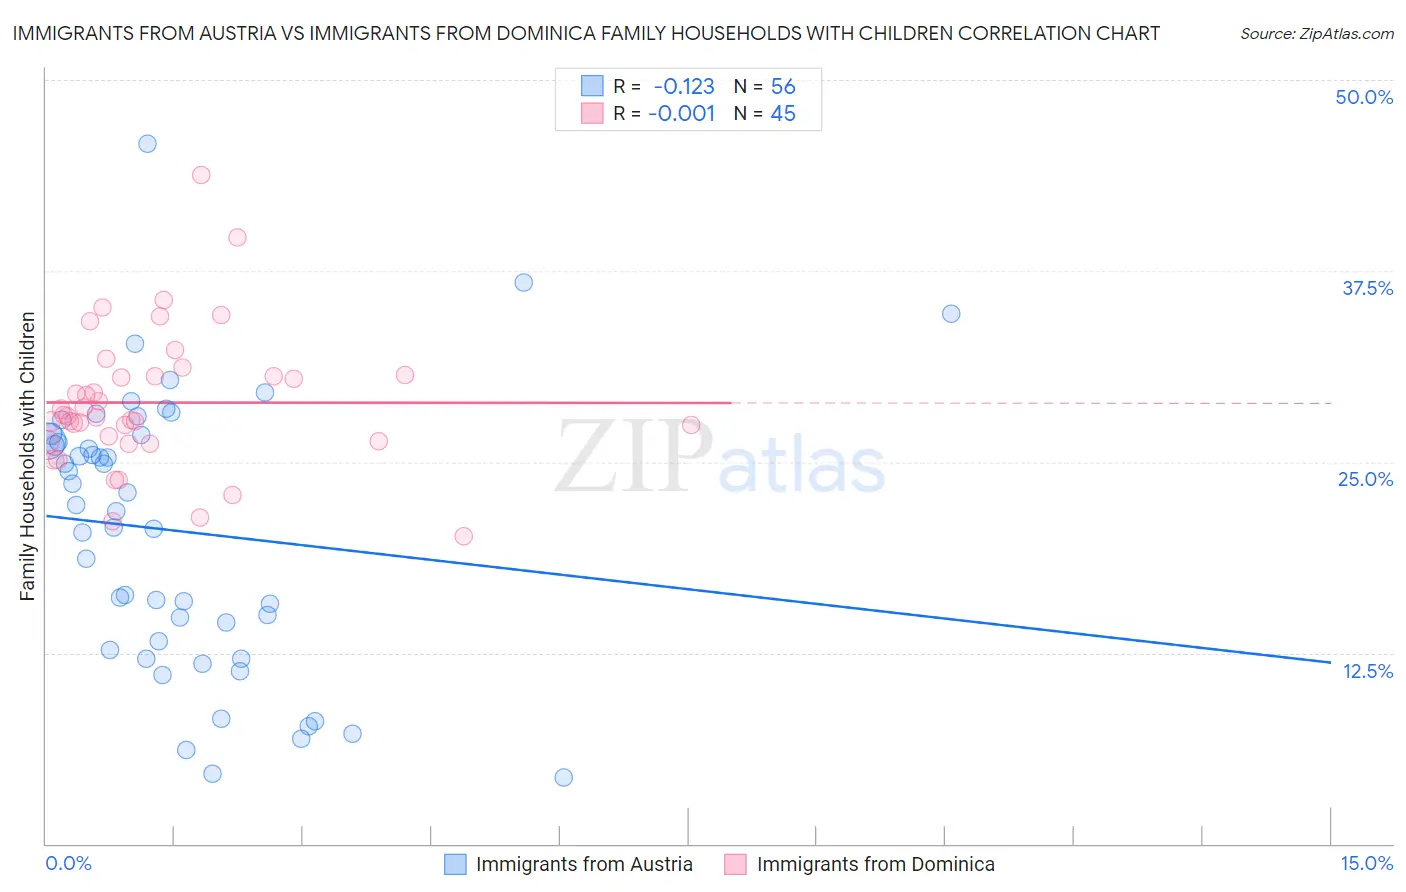
Immigrants from Austria vs Immigrants from Dominica Family Households with Children Correlation Chart
The statistical analysis conducted on geographies consisting of 167,913,233 people shows a poor negative correlation between the proportion of Immigrants from Austria and percentage of family households with children in the United States with a correlation coefficient (R) of -0.123 and weighted average of 25.8%. Similarly, the statistical analysis conducted on geographies consisting of 83,778,248 people shows no correlation between the proportion of Immigrants from Dominica and percentage of family households with children in the United States with a correlation coefficient (R) of -0.001 and weighted average of 27.2%, a difference of 5.5%.
Family Households with Children Correlation Summary
| Measurement | Immigrants from Austria | Immigrants from Dominica |
| Minimum | 4.3% | 20.2% |
| Maximum | 45.8% | 43.8% |
| Range | 41.5% | 23.6% |
| Mean | 20.5% | 28.9% |
| Median | 22.0% | 28.0% |
| Interquartile 25% (IQ1) | 13.0% | 26.3% |
| Interquartile 75% (IQ3) | 26.6% | 30.7% |
| Interquartile Range (IQR) | 13.6% | 4.3% |
| Standard Deviation (Sample) | 9.0% | 4.6% |
| Standard Deviation (Population) | 8.9% | 4.5% |
Similar Demographics by Family Households with Children
Demographics Similar to Immigrants from Austria by Family Households with Children
In terms of family households with children, the demographic groups most similar to Immigrants from Austria are Immigrants from Switzerland (25.7%, a difference of 0.080%), Slovene (25.8%, a difference of 0.23%), Slovak (25.7%, a difference of 0.23%), Immigrants from Croatia (25.7%, a difference of 0.24%), and Immigrants from West Indies (25.7%, a difference of 0.34%).
| Demographics | Rating | Rank | Family Households with Children |
| Barbadians | 0.0 /100 | #325 | Tragic 26.0% |
| Immigrants | Ireland | 0.0 /100 | #326 | Tragic 26.0% |
| Immigrants | Barbados | 0.0 /100 | #327 | Tragic 26.0% |
| Immigrants | Albania | 0.0 /100 | #328 | Tragic 25.9% |
| Cypriots | 0.0 /100 | #329 | Tragic 25.9% |
| Immigrants | Latvia | 0.0 /100 | #330 | Tragic 25.9% |
| Slovenes | 0.0 /100 | #331 | Tragic 25.8% |
| Immigrants | Austria | 0.0 /100 | #332 | Tragic 25.8% |
| Immigrants | Switzerland | 0.0 /100 | #333 | Tragic 25.7% |
| Slovaks | 0.0 /100 | #334 | Tragic 25.7% |
| Immigrants | Croatia | 0.0 /100 | #335 | Tragic 25.7% |
| Immigrants | West Indies | 0.0 /100 | #336 | Tragic 25.7% |
| Puerto Ricans | 0.0 /100 | #337 | Tragic 25.6% |
| Arapaho | 0.0 /100 | #338 | Tragic 25.6% |
| Immigrants | St. Vincent and the Grenadines | 0.0 /100 | #339 | Tragic 25.6% |
Demographics Similar to Immigrants from Dominica by Family Households with Children
In terms of family households with children, the demographic groups most similar to Immigrants from Dominica are Welsh (27.2%, a difference of 0.010%), Okinawan (27.2%, a difference of 0.010%), Immigrants from Ukraine (27.2%, a difference of 0.020%), African (27.2%, a difference of 0.040%), and Northern European (27.2%, a difference of 0.050%).
| Demographics | Rating | Rank | Family Households with Children |
| Immigrants | Haiti | 20.3 /100 | #205 | Fair 27.2% |
| Immigrants | Micronesia | 20.2 /100 | #206 | Fair 27.2% |
| Haitians | 19.8 /100 | #207 | Poor 27.2% |
| Immigrants | Poland | 16.4 /100 | #208 | Poor 27.2% |
| Dutch West Indians | 15.8 /100 | #209 | Poor 27.2% |
| Immigrants | Ukraine | 14.4 /100 | #210 | Poor 27.2% |
| Welsh | 14.2 /100 | #211 | Poor 27.2% |
| Immigrants | Dominica | 13.9 /100 | #212 | Poor 27.2% |
| Okinawans | 13.7 /100 | #213 | Poor 27.2% |
| Africans | 13.0 /100 | #214 | Poor 27.2% |
| Northern Europeans | 12.8 /100 | #215 | Poor 27.2% |
| Cubans | 12.2 /100 | #216 | Poor 27.1% |
| U.S. Virgin Islanders | 12.1 /100 | #217 | Poor 27.1% |
| Greeks | 11.4 /100 | #218 | Poor 27.1% |
| Immigrants | Japan | 10.7 /100 | #219 | Poor 27.1% |