Immigrants from Armenia vs Potawatomi Single Mother Households
COMPARE
Immigrants from Armenia
Potawatomi
Single Mother Households
Single Mother Households Comparison
Immigrants from Armenia
Potawatomi
5.2%
SINGLE MOTHER HOUSEHOLDS
99.9/ 100
METRIC RATING
18th/ 347
METRIC RANK
6.6%
SINGLE MOTHER HOUSEHOLDS
15.5/ 100
METRIC RATING
199th/ 347
METRIC RANK
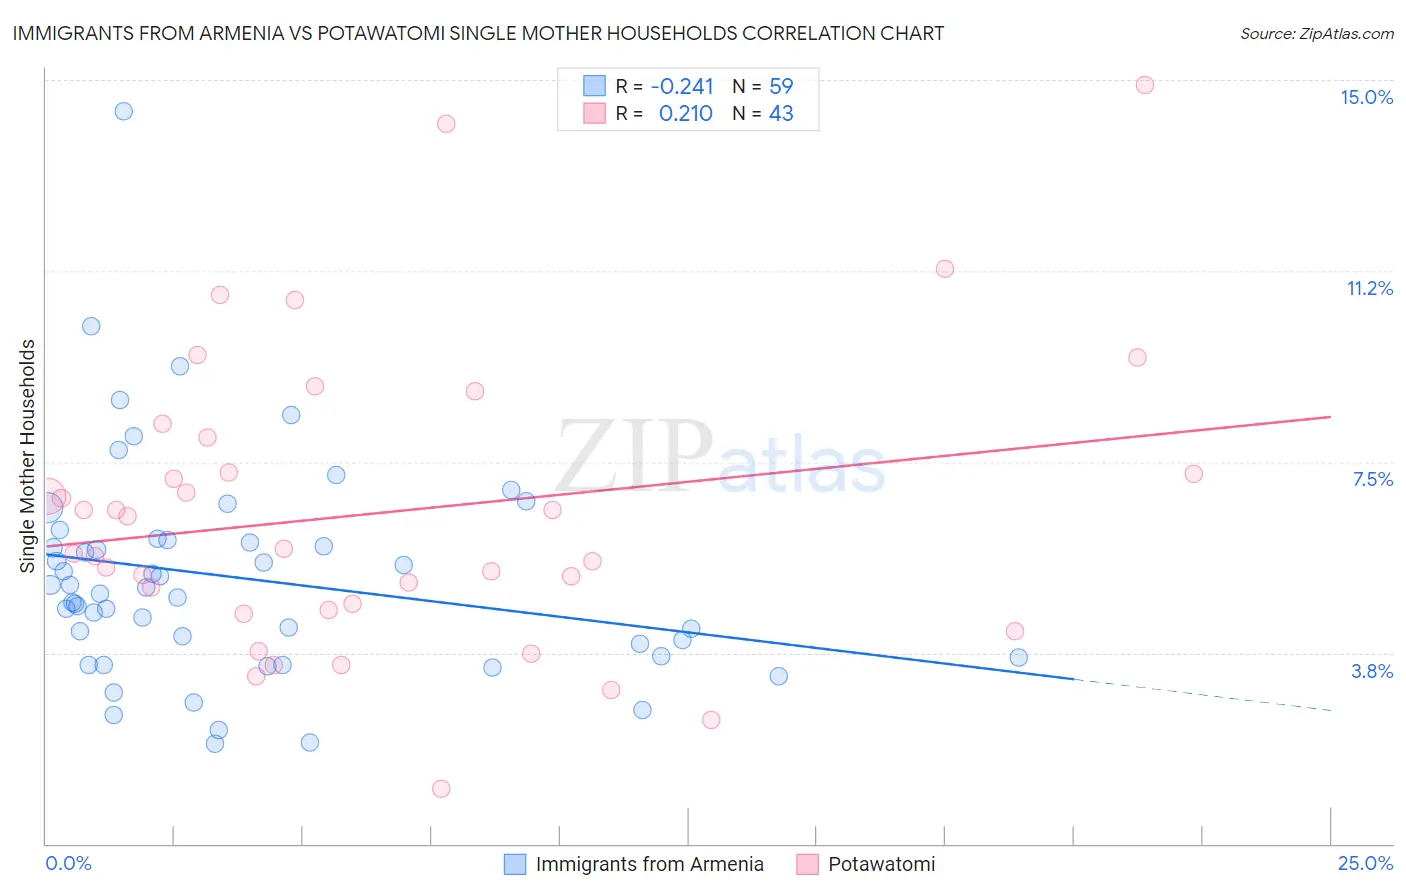
Immigrants from Armenia vs Potawatomi Single Mother Households Correlation Chart
The statistical analysis conducted on geographies consisting of 97,664,769 people shows a weak negative correlation between the proportion of Immigrants from Armenia and percentage of single mother households in the United States with a correlation coefficient (R) of -0.241 and weighted average of 5.2%. Similarly, the statistical analysis conducted on geographies consisting of 117,659,768 people shows a weak positive correlation between the proportion of Potawatomi and percentage of single mother households in the United States with a correlation coefficient (R) of 0.210 and weighted average of 6.6%, a difference of 28.1%.
Single Mother Households Correlation Summary
| Measurement | Immigrants from Armenia | Potawatomi |
| Minimum | 2.0% | 1.1% |
| Maximum | 14.4% | 14.9% |
| Range | 12.4% | 13.8% |
| Mean | 5.2% | 6.5% |
| Median | 4.9% | 5.8% |
| Interquartile 25% (IQ1) | 3.7% | 4.6% |
| Interquartile 75% (IQ3) | 6.0% | 8.0% |
| Interquartile Range (IQR) | 2.3% | 3.4% |
| Standard Deviation (Sample) | 2.2% | 2.9% |
| Standard Deviation (Population) | 2.1% | 2.9% |
Similar Demographics by Single Mother Households
Demographics Similar to Immigrants from Armenia by Single Mother Households
In terms of single mother households, the demographic groups most similar to Immigrants from Armenia are Chinese (5.2%, a difference of 0.11%), Maltese (5.2%, a difference of 0.57%), Eastern European (5.2%, a difference of 0.63%), Soviet Union (5.1%, a difference of 0.78%), and Indian (Asian) (5.1%, a difference of 0.99%).
| Demographics | Rating | Rank | Single Mother Households |
| Immigrants | China | 99.9 /100 | #11 | Exceptional 5.1% |
| Cypriots | 99.9 /100 | #12 | Exceptional 5.1% |
| Immigrants | India | 99.9 /100 | #13 | Exceptional 5.1% |
| Immigrants | Australia | 99.9 /100 | #14 | Exceptional 5.1% |
| Immigrants | Eastern Asia | 99.9 /100 | #15 | Exceptional 5.1% |
| Indians (Asian) | 99.9 /100 | #16 | Exceptional 5.1% |
| Soviet Union | 99.9 /100 | #17 | Exceptional 5.1% |
| Immigrants | Armenia | 99.9 /100 | #18 | Exceptional 5.2% |
| Chinese | 99.9 /100 | #19 | Exceptional 5.2% |
| Maltese | 99.9 /100 | #20 | Exceptional 5.2% |
| Eastern Europeans | 99.8 /100 | #21 | Exceptional 5.2% |
| Thais | 99.8 /100 | #22 | Exceptional 5.2% |
| Immigrants | Austria | 99.8 /100 | #23 | Exceptional 5.2% |
| Armenians | 99.8 /100 | #24 | Exceptional 5.2% |
| Immigrants | Japan | 99.8 /100 | #25 | Exceptional 5.2% |
Demographics Similar to Potawatomi by Single Mother Households
In terms of single mother households, the demographic groups most similar to Potawatomi are Hawaiian (6.6%, a difference of 0.11%), Immigrants from Ethiopia (6.6%, a difference of 0.16%), Moroccan (6.6%, a difference of 0.36%), South American (6.6%, a difference of 0.47%), and Uruguayan (6.6%, a difference of 0.47%).
| Demographics | Rating | Rank | Single Mother Households |
| Americans | 19.0 /100 | #192 | Poor 6.6% |
| Colombians | 18.3 /100 | #193 | Poor 6.6% |
| Immigrants | Uganda | 18.3 /100 | #194 | Poor 6.6% |
| South Americans | 18.0 /100 | #195 | Poor 6.6% |
| Uruguayans | 18.0 /100 | #196 | Poor 6.6% |
| Moroccans | 17.4 /100 | #197 | Poor 6.6% |
| Hawaiians | 16.1 /100 | #198 | Poor 6.6% |
| Potawatomi | 15.5 /100 | #199 | Poor 6.6% |
| Immigrants | Ethiopia | 14.7 /100 | #200 | Poor 6.6% |
| Venezuelans | 12.9 /100 | #201 | Poor 6.6% |
| Guamanians/Chamorros | 12.4 /100 | #202 | Poor 6.6% |
| Immigrants | Peru | 12.0 /100 | #203 | Poor 6.7% |
| Immigrants | Fiji | 11.9 /100 | #204 | Poor 6.7% |
| Cree | 11.9 /100 | #205 | Poor 6.7% |
| German Russians | 11.5 /100 | #206 | Poor 6.7% |