Immigrants from Armenia vs Dominican Births to Unmarried Women
COMPARE
Immigrants from Armenia
Dominican
Births to Unmarried Women
Births to Unmarried Women Comparison
Immigrants from Armenia
Dominicans
26.1%
BIRTHS TO UNMARRIED WOMEN
99.9/ 100
METRIC RATING
18th/ 347
METRIC RANK
39.8%
BIRTHS TO UNMARRIED WOMEN
0.0/ 100
METRIC RATING
315th/ 347
METRIC RANK
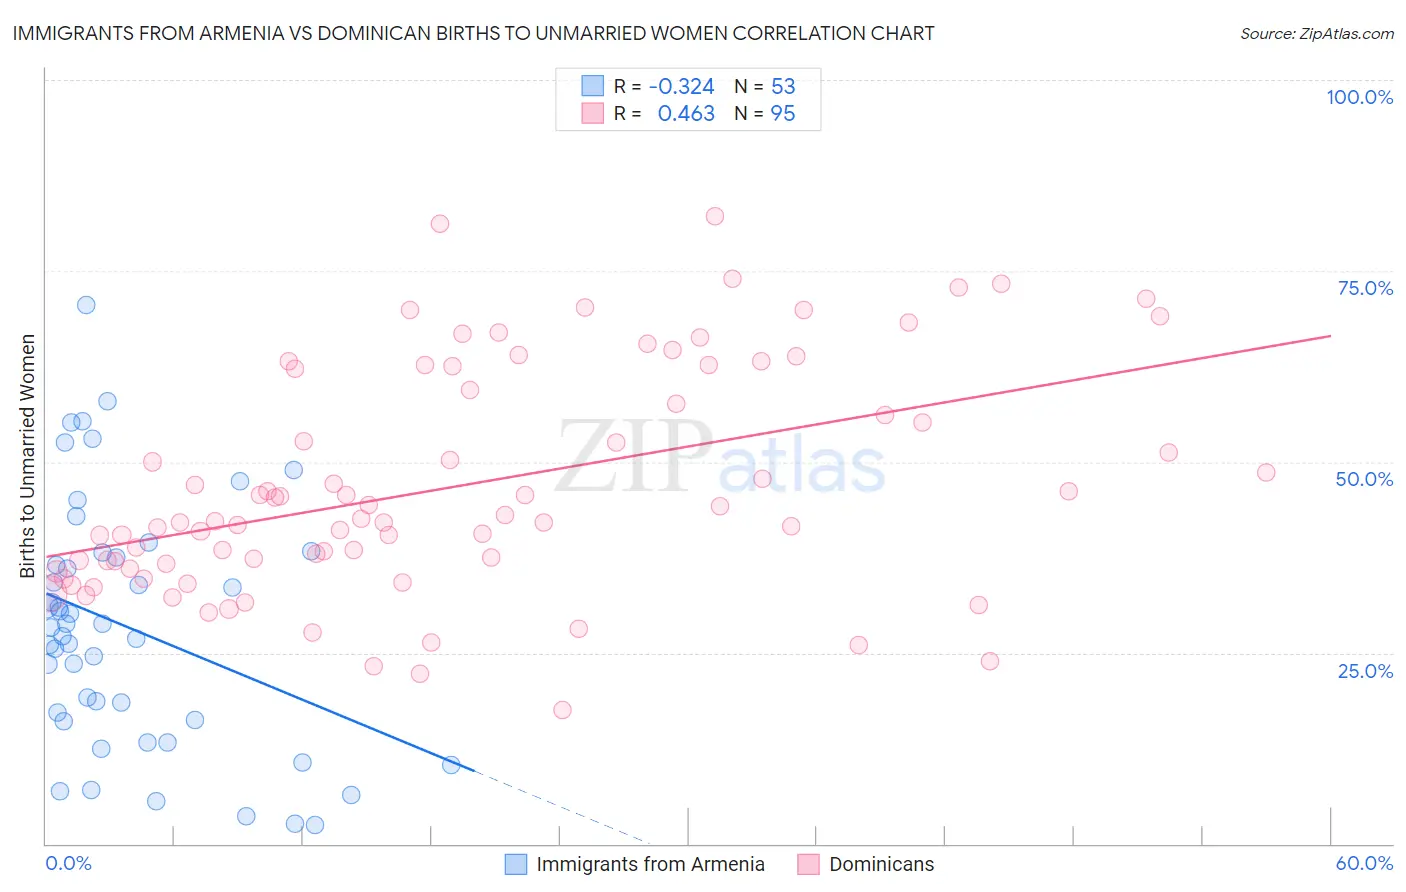
Immigrants from Armenia vs Dominican Births to Unmarried Women Correlation Chart
The statistical analysis conducted on geographies consisting of 94,792,248 people shows a mild negative correlation between the proportion of Immigrants from Armenia and percentage of births to unmarried women in the United States with a correlation coefficient (R) of -0.324 and weighted average of 26.1%. Similarly, the statistical analysis conducted on geographies consisting of 335,131,463 people shows a moderate positive correlation between the proportion of Dominicans and percentage of births to unmarried women in the United States with a correlation coefficient (R) of 0.463 and weighted average of 39.8%, a difference of 52.9%.
Births to Unmarried Women Correlation Summary
| Measurement | Immigrants from Armenia | Dominican |
| Minimum | 2.5% | 17.5% |
| Maximum | 70.6% | 82.1% |
| Range | 68.1% | 64.6% |
| Mean | 28.3% | 46.9% |
| Median | 28.3% | 42.5% |
| Interquartile 25% (IQ1) | 16.1% | 36.6% |
| Interquartile 75% (IQ3) | 37.8% | 62.2% |
| Interquartile Range (IQR) | 21.7% | 25.6% |
| Standard Deviation (Sample) | 16.0% | 14.8% |
| Standard Deviation (Population) | 15.8% | 14.7% |
Similar Demographics by Births to Unmarried Women
Demographics Similar to Immigrants from Armenia by Births to Unmarried Women
In terms of births to unmarried women, the demographic groups most similar to Immigrants from Armenia are Armenian (26.2%, a difference of 0.58%), Immigrants from Korea (26.3%, a difference of 0.80%), Soviet Union (26.3%, a difference of 0.93%), Immigrants from Uzbekistan (25.8%, a difference of 1.1%), and Burmese (26.4%, a difference of 1.2%).
| Demographics | Rating | Rank | Births to Unmarried Women |
| Immigrants | Israel | 100.0 /100 | #11 | Exceptional 25.1% |
| Indians (Asian) | 100.0 /100 | #12 | Exceptional 25.3% |
| Iranians | 100.0 /100 | #13 | Exceptional 25.3% |
| Immigrants | Lebanon | 100.0 /100 | #14 | Exceptional 25.3% |
| Immigrants | Singapore | 100.0 /100 | #15 | Exceptional 25.6% |
| Immigrants | Belarus | 100.0 /100 | #16 | Exceptional 25.6% |
| Immigrants | Uzbekistan | 100.0 /100 | #17 | Exceptional 25.8% |
| Immigrants | Armenia | 99.9 /100 | #18 | Exceptional 26.1% |
| Armenians | 99.9 /100 | #19 | Exceptional 26.2% |
| Immigrants | Korea | 99.9 /100 | #20 | Exceptional 26.3% |
| Soviet Union | 99.9 /100 | #21 | Exceptional 26.3% |
| Burmese | 99.9 /100 | #22 | Exceptional 26.4% |
| Immigrants | Japan | 99.9 /100 | #23 | Exceptional 26.4% |
| Immigrants | Australia | 99.9 /100 | #24 | Exceptional 26.6% |
| Cambodians | 99.9 /100 | #25 | Exceptional 26.7% |
Demographics Similar to Dominicans by Births to Unmarried Women
In terms of births to unmarried women, the demographic groups most similar to Dominicans are Immigrants from Caribbean (39.8%, a difference of 0.040%), Apache (39.9%, a difference of 0.060%), African (39.7%, a difference of 0.33%), Immigrants from Dominican Republic (40.1%, a difference of 0.61%), and U.S. Virgin Islander (39.6%, a difference of 0.67%).
| Demographics | Rating | Rank | Births to Unmarried Women |
| Aleuts | 0.0 /100 | #308 | Tragic 39.3% |
| Cubans | 0.0 /100 | #309 | Tragic 39.4% |
| Immigrants | Dominica | 0.0 /100 | #310 | Tragic 39.5% |
| Immigrants | Azores | 0.0 /100 | #311 | Tragic 39.6% |
| U.S. Virgin Islanders | 0.0 /100 | #312 | Tragic 39.6% |
| Africans | 0.0 /100 | #313 | Tragic 39.7% |
| Immigrants | Caribbean | 0.0 /100 | #314 | Tragic 39.8% |
| Dominicans | 0.0 /100 | #315 | Tragic 39.8% |
| Apache | 0.0 /100 | #316 | Tragic 39.9% |
| Immigrants | Dominican Republic | 0.0 /100 | #317 | Tragic 40.1% |
| Immigrants | Bahamas | 0.0 /100 | #318 | Tragic 40.1% |
| Yakama | 0.0 /100 | #319 | Tragic 40.3% |
| Crow | 0.0 /100 | #320 | Tragic 40.4% |
| Bahamians | 0.0 /100 | #321 | Tragic 40.8% |
| Cajuns | 0.0 /100 | #322 | Tragic 41.0% |