Hopi vs Peruvian Family Households with Children

COMPARE

Hopi
Race
Ancestry
AfghanAfricanAlaska NativeAlaskan AthabascanAlbanianAleutAlsatianAmericanApacheArabArapahoArgentineanArmenianAssyrian/Chaldean/SyriacAustralianAustrianBahamianBangladeshiBarbadianBasqueBelgianBelizeanBermudanBhutaneseBlackfeetBolivianBrazilianBritishBritish West IndianBulgarianBurmeseCajunCambodianCanadianCape VerdeanCarpatho RusynCelticCentral AmericanCentral American IndianCherokeeCheyenneChickasawChileanChineseChippewaChoctawColombianColvilleComancheCosta RicanCreeCreekCroatianCrowCubanCypriotCzechCzechoslovakianDanishDelawareDominicanDutchDutch West IndianEastern EuropeanEcuadorianEgyptianEnglishEstonianEthiopianEuropeanFijianFilipinoFinnishFrenchFrench American IndianFrench CanadianGermanGerman RussianGhanaianGreekGuamanian/ChamorroGuatemalanGuyaneseHaitianHmongHonduranHopiHoumaHungarianIcelanderIndian (Asian)IndonesianInupiatIranianIraqiIrishIroquoisIsraeliItalianJamaicanJapaneseJordanianKenyanKiowaKoreanLaotianLatvianLebaneseLiberianLithuanianLumbeeLuxembourgerMacedonianMalaysianMalteseMarshalleseMenomineeMexicanMexican American IndianMongolianMoroccanNative HawaiianNavajoNepaleseNew ZealanderNicaraguanNigerianNorthern EuropeanNorwegianOkinawanOsageOttawaPaiutePakistaniPalestinianPanamanianParaguayanPennsylvania GermanPimaPolishPortuguesePotawatomiPuebloPuerto RicanPuget Sound SalishRomanianRussianSalvadoranSamoanScandinavianScotch-IrishScottishSeminoleSenegaleseSerbianShoshoneSierra LeoneanSiouxSlavicSlovakSloveneSomaliSouth AfricanSouth AmericanSouth American IndianSoviet UnionSpaniardSpanishSpanish AmericanSpanish American IndianSri LankanSubsaharan AfricanSudaneseSwedishSwissSyrianTaiwaneseThaiTlingit-HaidaTohono O'OdhamTonganTrinidadian and TobagonianTsimshianTurkishU.S. Virgin IslanderUgandanUkrainianUruguayanUteVenezuelanVietnameseWelshWest IndianYakamaYaquiYugoslavianYumanYup'ikZimbabwean
Immigration
NonimmigrantsImmigrantsAfghanistanAfricaAlbaniaArgentinaArmeniaAsiaAustraliaAustriaBahamasBangladeshBarbadosBelarusBelgiumBelizeBoliviaBosnia and HerzegovinaBrazilBulgariaBurma/MyanmarCabo VerdeCambodiaCameroonCanadaCaribbeanCentral AmericaChileChinaColombiaCongoCosta RicaCroatiaCubaCzechoslovakiaDenmarkDominicaDominican RepublicEastern AfricaEastern AsiaEastern EuropeEcuadorEgyptEl SalvadorEnglandEritreaEthiopiaEuropeFijiFranceGermanyGhanaGreeceGrenadaGuatemalaGuyanaHaitiHondurasHong KongHungaryIndiaIndonesiaIranIraqIrelandIsraelItalyJamaicaJapanJordanKazakhstanKenyaKoreaKuwaitLaosLatin AmericaLatviaLebanonLiberiaLithuaniaMalaysiaMexicoMicronesiaMiddle AfricaMoldovaMoroccoNepalNetherlandsNicaraguaNigeriaNorth AmericaNorth MacedoniaNorthern AfricaNorthern EuropeNorwayOceaniaPakistanPanamaPeruPhilippinesPolandPortugalRomaniaRussiaSaudi ArabiaScotlandSenegalSerbiaSierra LeoneSingaporeSomaliaSouth AfricaSouth AmericaSouth Central AsiaSouth Eastern AsiaSouthern EuropeSpainSri LankaSt. Vincent and the GrenadinesSudanSwedenSwitzerlandSyriaTaiwanThailandTrinidad and TobagoTurkeyUgandaUkraineUruguayUzbekistanVenezuelaVietnamWest IndiesWestern AfricaWestern AsiaWestern EuropeYemenZaireZimbabweAzores
Peruvian
Race
Ancestry
AfghanAfricanAlaska NativeAlaskan AthabascanAlbanianAleutAlsatianAmericanApacheArabArapahoArgentineanArmenianAssyrian/Chaldean/SyriacAustralianAustrianBahamianBangladeshiBarbadianBasqueBelgianBelizeanBermudanBhutaneseBlackfeetBolivianBrazilianBritishBritish West IndianBulgarianBurmeseCajunCambodianCanadianCape VerdeanCarpatho RusynCelticCentral AmericanCentral American IndianCherokeeCheyenneChickasawChileanChineseChippewaChoctawColombianColvilleComancheCosta RicanCreeCreekCroatianCrowCubanCypriotCzechCzechoslovakianDanishDelawareDominicanDutchDutch West IndianEastern EuropeanEcuadorianEgyptianEnglishEstonianEthiopianEuropeanFijianFilipinoFinnishFrenchFrench American IndianFrench CanadianGermanGerman RussianGhanaianGreekGuamanian/ChamorroGuatemalanGuyaneseHaitianHmongHonduranHoumaHungarianIcelanderIndian (Asian)IndonesianInupiatIranianIraqiIrishIroquoisIsraeliItalianJamaicanJapaneseJordanianKenyanKiowaKoreanLaotianLatvianLebaneseLiberianLithuanianLumbeeLuxembourgerMacedonianMalaysianMalteseMarshalleseMenomineeMexicanMexican American IndianMongolianMoroccanNative HawaiianNavajoNepaleseNew ZealanderNicaraguanNigerianNorthern EuropeanNorwegianOkinawanOsageOttawaPaiutePakistaniPalestinianPanamanianParaguayanPennsylvania GermanPeruvianPimaPolishPortuguesePotawatomiPuebloPuerto RicanPuget Sound SalishRomanianRussianSalvadoranSamoanScandinavianScotch-IrishScottishSeminoleSenegaleseSerbianShoshoneSierra LeoneanSiouxSlavicSlovakSloveneSomaliSouth AfricanSouth AmericanSouth American IndianSoviet UnionSpaniardSpanishSpanish AmericanSpanish American IndianSri LankanSubsaharan AfricanSudaneseSwedishSwissSyrianTaiwaneseThaiTlingit-HaidaTohono O'OdhamTonganTrinidadian and TobagonianTsimshianTurkishU.S. Virgin IslanderUgandanUkrainianUruguayanUteVenezuelanVietnameseWelshWest IndianYakamaYaquiYugoslavianYumanYup'ikZimbabwean
Immigration
NonimmigrantsImmigrantsAfghanistanAfricaAlbaniaArgentinaArmeniaAsiaAustraliaAustriaBahamasBangladeshBarbadosBelarusBelgiumBelizeBoliviaBosnia and HerzegovinaBrazilBulgariaBurma/MyanmarCabo VerdeCambodiaCameroonCanadaCaribbeanCentral AmericaChileChinaColombiaCongoCosta RicaCroatiaCubaCzechoslovakiaDenmarkDominicaDominican RepublicEastern AfricaEastern AsiaEastern EuropeEcuadorEgyptEl SalvadorEnglandEritreaEthiopiaEuropeFijiFranceGermanyGhanaGreeceGrenadaGuatemalaGuyanaHaitiHondurasHong KongHungaryIndiaIndonesiaIranIraqIrelandIsraelItalyJamaicaJapanJordanKazakhstanKenyaKoreaKuwaitLaosLatin AmericaLatviaLebanonLiberiaLithuaniaMalaysiaMexicoMicronesiaMiddle AfricaMoldovaMoroccoNepalNetherlandsNicaraguaNigeriaNorth AmericaNorth MacedoniaNorthern AfricaNorthern EuropeNorwayOceaniaPakistanPanamaPeruPhilippinesPolandPortugalRomaniaRussiaSaudi ArabiaScotlandSenegalSerbiaSierra LeoneSingaporeSomaliaSouth AfricaSouth AmericaSouth Central AsiaSouth Eastern AsiaSouthern EuropeSpainSri LankaSt. Vincent and the GrenadinesSudanSwedenSwitzerlandSyriaTaiwanThailandTrinidad and TobagoTurkeyUgandaUkraineUruguayUzbekistanVenezuelaVietnamWest IndiesWestern AfricaWestern AsiaWestern EuropeYemenZaireZimbabweAzores
Family Households with Children
Income
Poverty
Unemployment
Labor Participation
Family Structure
Vehicle Availability
Education Level
Disability

Family Households with Children Comparison

Hopi

Peruvians

Tragic
Exceptional
25.2%
FAMILY HOUSEHOLDS WITH CHILDREN
0.0/ 100
METRIC RATING
343rd/ 347
METRIC RANK
29.0%
FAMILY HOUSEHOLDS WITH CHILDREN
100.0/ 100
METRIC RATING
47th/ 347
METRIC RANK

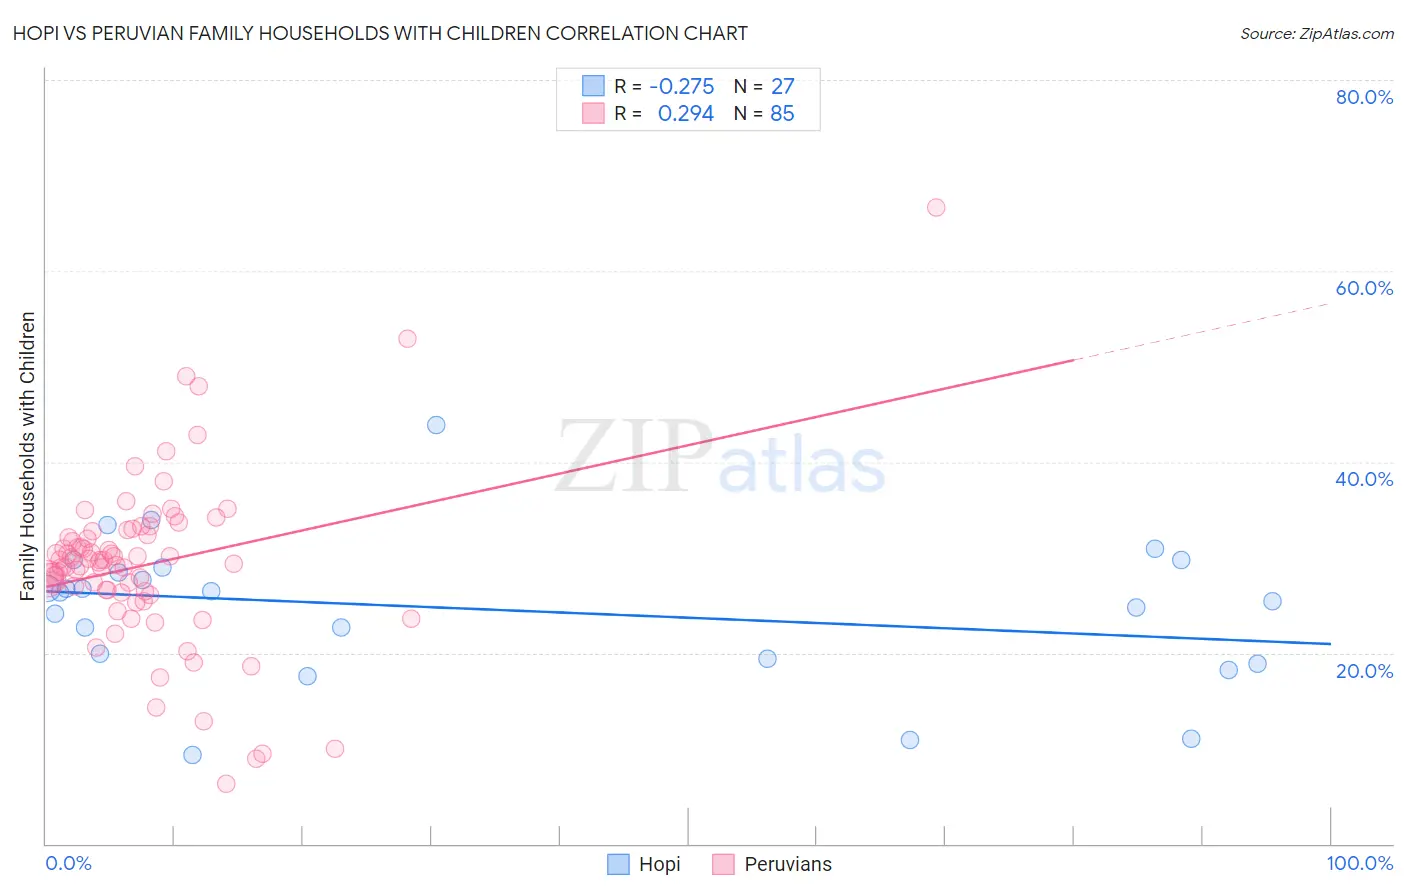
Hopi vs Peruvian Family Households with Children Correlation Chart

The statistical analysis conducted on geographies consisting of 74,716,613 people shows a weak negative correlation between the proportion of Hopi and percentage of family households with children in the United States with a correlation coefficient (R) of -0.275 and weighted average of 25.2%. Similarly, the statistical analysis conducted on geographies consisting of 362,805,667 people shows a weak positive correlation between the proportion of Peruvians and percentage of family households with children in the United States with a correlation coefficient (R) of 0.294 and weighted average of 29.0%, a difference of 14.9%.
Hopi vs Peruvian Family Households with Children

Family Households with Children Correlation Summary

MeasurementHopiPeruvian
Minimum9.3%6.2%
Maximum43.9%66.7%
Range34.6%60.4%
Mean24.6%29.2%
Median26.3%29.5%
Interquartile 25% (IQ1)19.4%26.3%
Interquartile 75% (IQ3)29.0%32.5%
Interquartile Range (IQR)9.6%6.2%
Standard Deviation (Sample)7.6%8.9%
Standard Deviation (Population)7.4%8.8%

Similar Demographics by Family Households with Children

Demographics Similar to Hopi by Family Households with Children

In terms of family households with children, the demographic groups most similar to Hopi are Pueblo (25.2%, a difference of 0.11%), Alsatian (25.3%, a difference of 0.16%), Immigrants from Grenada (25.2%, a difference of 0.28%), Carpatho Rusyn (25.2%, a difference of 0.29%), and Immigrants from Serbia (25.5%, a difference of 0.84%).
DemographicsRating | RankFamily Households with Children
Immigrants | Switzerland
0.0
/100
|
#333
Tragic
25.7%
Slovaks
0.0
/100
|
#334
Tragic
25.7%
Immigrants | Croatia
0.0
/100
|
#335
Tragic
25.7%
Immigrants | West Indies
0.0
/100
|
#336
Tragic
25.7%
Puerto Ricans
0.0
/100
|
#337
Tragic
25.6%
Arapaho
0.0
/100
|
#338
Tragic
25.6%
Immigrants | St. Vincent and the Grenadines
0.0
/100
|
#339
Tragic
25.6%
Immigrants | Armenia
0.0
/100
|
#340
Tragic
25.6%
Immigrants | Serbia
0.0
/100
|
#341
Tragic
25.5%
Alsatians
0.0
/100
|
#342
Tragic
25.3%
Hopi
0.0
/100
|
#343
Tragic
25.2%
Pueblo
0.0
/100
|
#344
Tragic
25.2%
Immigrants | Grenada
0.0
/100
|
#345
Tragic
25.2%
Carpatho Rusyns
0.0
/100
|
#346
Tragic
25.2%
Soviet Union
0.0
/100
|
#347
Tragic
24.8%

Demographics Similar to Peruvians by Family Households with Children

In terms of family households with children, the demographic groups most similar to Peruvians are Immigrants from Philippines (29.0%, a difference of 0.010%), Apache (29.0%, a difference of 0.030%), Fijian (29.0%, a difference of 0.090%), Jordanian (29.0%, a difference of 0.12%), and Immigrants from Taiwan (29.0%, a difference of 0.15%).
DemographicsRating | RankFamily Households with Children
Central Americans
100.0
/100
|
#40
Exceptional
29.1%
Immigrants | South Eastern Asia
100.0
/100
|
#41
Exceptional
29.1%
Spanish American Indians
100.0
/100
|
#42
Exceptional
29.1%
Asians
100.0
/100
|
#43
Exceptional
29.1%
Immigrants | Taiwan
100.0
/100
|
#44
Exceptional
29.0%
Fijians
100.0
/100
|
#45
Exceptional
29.0%
Immigrants | Philippines
100.0
/100
|
#46
Exceptional
29.0%
Peruvians
100.0
/100
|
#47
Exceptional
29.0%
Apache
100.0
/100
|
#48
Exceptional
29.0%
Jordanians
100.0
/100
|
#49
Exceptional
29.0%
Immigrants | Immigrants
100.0
/100
|
#50
Exceptional
28.9%
Immigrants | Peru
100.0
/100
|
#51
Exceptional
28.9%
Guatemalans
100.0
/100
|
#52
Exceptional
28.9%
Immigrants | Cambodia
100.0
/100
|
#53
Exceptional
28.9%
Sierra Leoneans
100.0
/100
|
#54
Exceptional
28.9%