German Russian vs Immigrants from Africa Family Households
COMPARE
German Russian
Immigrants from Africa
Family Households
Family Households Comparison
German Russians
Immigrants from Africa
60.9%
FAMILY HOUSEHOLDS
0.0/ 100
METRIC RATING
336th/ 347
METRIC RANK
62.4%
FAMILY HOUSEHOLDS
0.0/ 100
METRIC RATING
300th/ 347
METRIC RANK
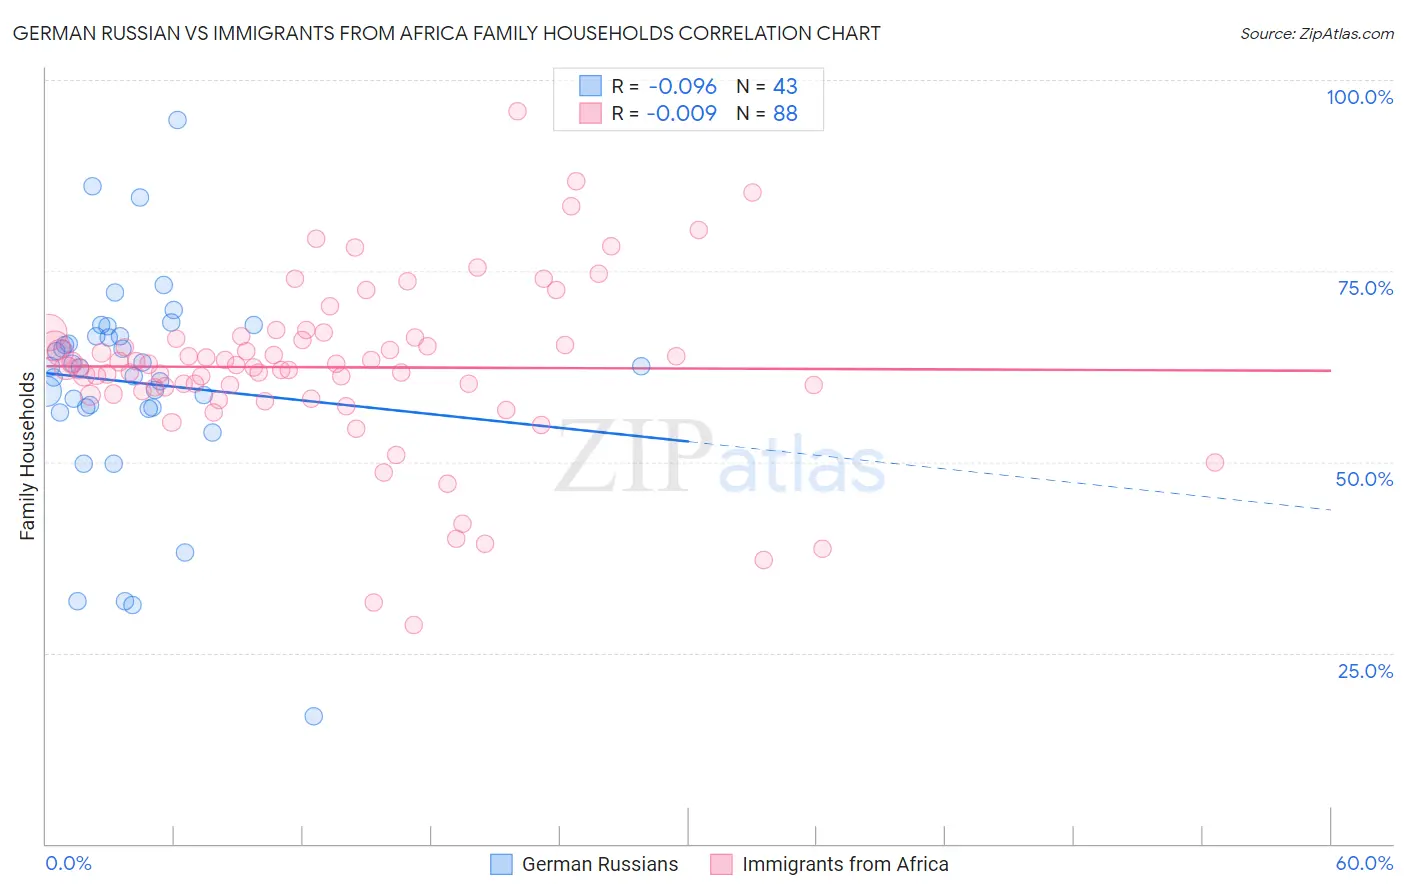
German Russian vs Immigrants from Africa Family Households Correlation Chart
The statistical analysis conducted on geographies consisting of 96,451,375 people shows a slight negative correlation between the proportion of German Russians and percentage of family households in the United States with a correlation coefficient (R) of -0.096 and weighted average of 60.9%. Similarly, the statistical analysis conducted on geographies consisting of 468,955,500 people shows no correlation between the proportion of Immigrants from Africa and percentage of family households in the United States with a correlation coefficient (R) of -0.009 and weighted average of 62.4%, a difference of 2.4%.
Family Households Correlation Summary
| Measurement | German Russian | Immigrants from Africa |
| Minimum | 16.7% | 28.7% |
| Maximum | 94.7% | 96.0% |
| Range | 78.1% | 67.3% |
| Mean | 60.4% | 62.4% |
| Median | 62.5% | 62.5% |
| Interquartile 25% (IQ1) | 57.1% | 59.1% |
| Interquartile 75% (IQ3) | 66.4% | 66.2% |
| Interquartile Range (IQR) | 9.4% | 7.2% |
| Standard Deviation (Sample) | 14.2% | 11.2% |
| Standard Deviation (Population) | 14.1% | 11.1% |
Similar Demographics by Family Households
Demographics Similar to German Russians by Family Households
In terms of family households, the demographic groups most similar to German Russians are Soviet Union (60.9%, a difference of 0.0%), Immigrants from Eritrea (60.8%, a difference of 0.14%), Carpatho Rusyn (61.1%, a difference of 0.28%), Immigrants from Saudi Arabia (60.7%, a difference of 0.35%), and Immigrants from Eastern Africa (61.1%, a difference of 0.40%).
| Demographics | Rating | Rank | Family Households |
| Cambodians | 0.0 /100 | #329 | Tragic 61.4% |
| Immigrants | Australia | 0.0 /100 | #330 | Tragic 61.3% |
| Immigrants | France | 0.0 /100 | #331 | Tragic 61.3% |
| Ethiopians | 0.0 /100 | #332 | Tragic 61.2% |
| Immigrants | Ethiopia | 0.0 /100 | #333 | Tragic 61.2% |
| Immigrants | Eastern Africa | 0.0 /100 | #334 | Tragic 61.1% |
| Carpatho Rusyns | 0.0 /100 | #335 | Tragic 61.1% |
| German Russians | 0.0 /100 | #336 | Tragic 60.9% |
| Soviet Union | 0.0 /100 | #337 | Tragic 60.9% |
| Immigrants | Eritrea | 0.0 /100 | #338 | Tragic 60.8% |
| Immigrants | Saudi Arabia | 0.0 /100 | #339 | Tragic 60.7% |
| Immigrants | Sudan | 0.0 /100 | #340 | Tragic 60.2% |
| Immigrants | Senegal | 0.0 /100 | #341 | Tragic 60.1% |
| Sudanese | 0.0 /100 | #342 | Tragic 60.0% |
| Senegalese | 0.0 /100 | #343 | Tragic 59.8% |
Demographics Similar to Immigrants from Africa by Family Households
In terms of family households, the demographic groups most similar to Immigrants from Africa are Immigrants from Kuwait (62.4%, a difference of 0.0%), Immigrants from Albania (62.4%, a difference of 0.020%), Immigrants from Kenya (62.3%, a difference of 0.060%), Immigrants from Spain (62.4%, a difference of 0.070%), and French American Indian (62.4%, a difference of 0.090%).
| Demographics | Rating | Rank | Family Households |
| Immigrants | Sweden | 0.0 /100 | #293 | Tragic 62.5% |
| Barbadians | 0.0 /100 | #294 | Tragic 62.5% |
| Okinawans | 0.0 /100 | #295 | Tragic 62.5% |
| Slovenes | 0.0 /100 | #296 | Tragic 62.4% |
| French American Indians | 0.0 /100 | #297 | Tragic 62.4% |
| Immigrants | Spain | 0.0 /100 | #298 | Tragic 62.4% |
| Immigrants | Kuwait | 0.0 /100 | #299 | Tragic 62.4% |
| Immigrants | Africa | 0.0 /100 | #300 | Tragic 62.4% |
| Immigrants | Albania | 0.0 /100 | #301 | Tragic 62.4% |
| Immigrants | Kenya | 0.0 /100 | #302 | Tragic 62.3% |
| Cree | 0.0 /100 | #303 | Tragic 62.3% |
| Iroquois | 0.0 /100 | #304 | Tragic 62.2% |
| Bermudans | 0.0 /100 | #305 | Tragic 62.2% |
| Africans | 0.0 /100 | #306 | Tragic 62.1% |
| Immigrants | Norway | 0.0 /100 | #307 | Tragic 62.1% |