Fijian vs Immigrants from England Single Father Households
COMPARE
Fijian
Immigrants from England
Single Father Households
Single Father Households Comparison
Fijians
Immigrants from England
3.0%
SINGLE FATHER HOUSEHOLDS
0.0/ 100
METRIC RATING
324th/ 347
METRIC RANK
2.2%
SINGLE FATHER HOUSEHOLDS
96.8/ 100
METRIC RATING
128th/ 347
METRIC RANK
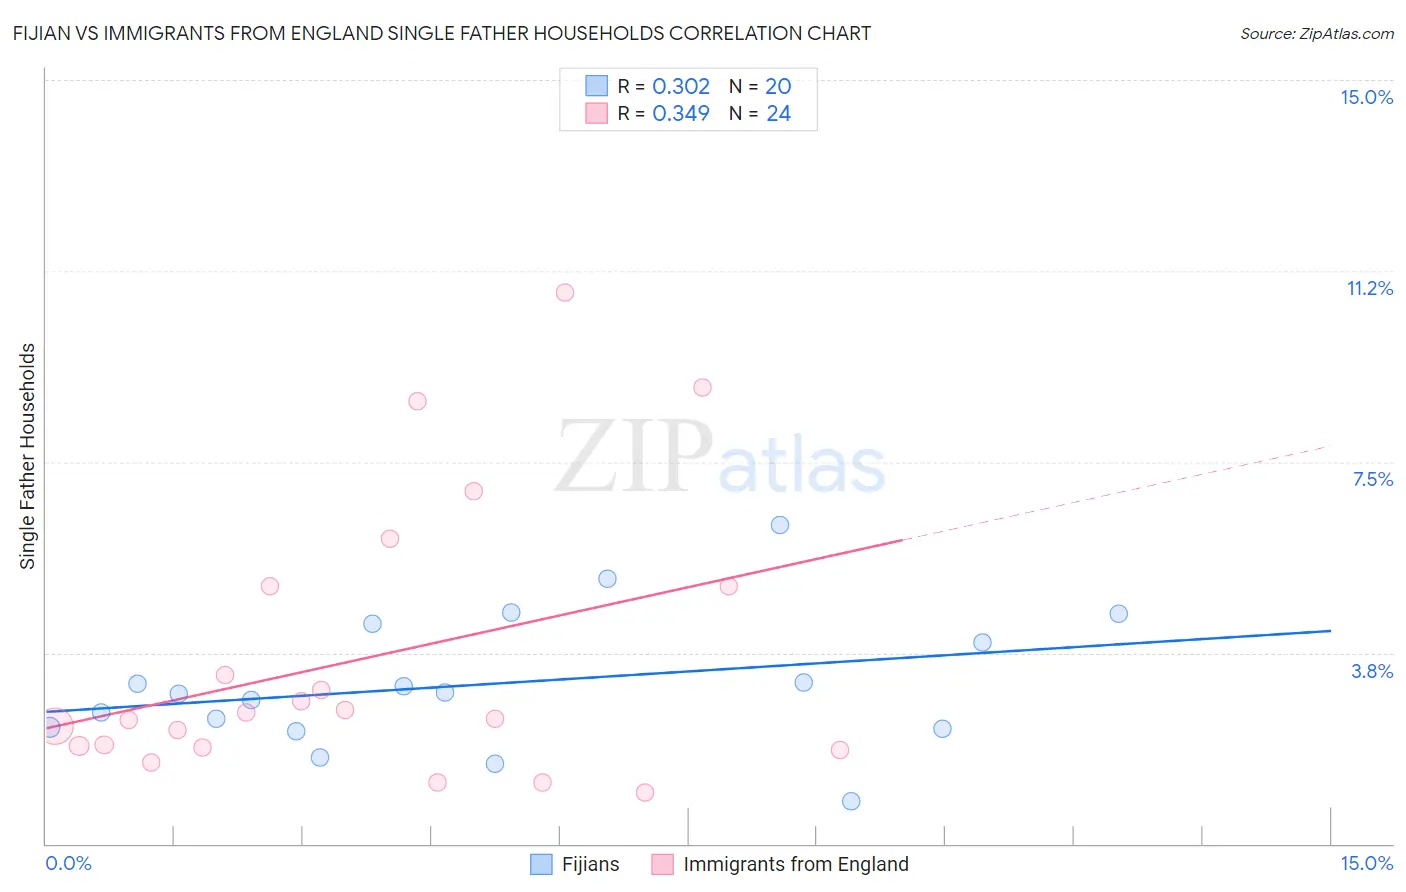
Fijian vs Immigrants from England Single Father Households Correlation Chart
The statistical analysis conducted on geographies consisting of 55,868,247 people shows a mild positive correlation between the proportion of Fijians and percentage of single father households in the United States with a correlation coefficient (R) of 0.302 and weighted average of 3.0%. Similarly, the statistical analysis conducted on geographies consisting of 387,838,921 people shows a mild positive correlation between the proportion of Immigrants from England and percentage of single father households in the United States with a correlation coefficient (R) of 0.349 and weighted average of 2.2%, a difference of 37.1%.
Single Father Households Correlation Summary
| Measurement | Fijian | Immigrants from England |
| Minimum | 0.84% | 1.0% |
| Maximum | 6.3% | 10.8% |
| Range | 5.4% | 9.8% |
| Mean | 3.1% | 3.7% |
| Median | 3.0% | 2.5% |
| Interquartile 25% (IQ1) | 2.3% | 1.9% |
| Interquartile 75% (IQ3) | 4.1% | 5.1% |
| Interquartile Range (IQR) | 1.9% | 3.2% |
| Standard Deviation (Sample) | 1.3% | 2.7% |
| Standard Deviation (Population) | 1.3% | 2.7% |
Similar Demographics by Single Father Households
Demographics Similar to Fijians by Single Father Households
In terms of single father households, the demographic groups most similar to Fijians are Immigrants from Central America (3.0%, a difference of 0.080%), Immigrants from Guatemala (3.0%, a difference of 0.39%), Mexican (3.0%, a difference of 0.92%), Immigrants from Mexico (3.0%, a difference of 1.2%), and Guatemalan (3.0%, a difference of 1.3%).
| Demographics | Rating | Rank | Single Father Households |
| Immigrants | El Salvador | 0.0 /100 | #317 | Tragic 2.9% |
| Cape Verdeans | 0.0 /100 | #318 | Tragic 2.9% |
| Ute | 0.0 /100 | #319 | Tragic 3.0% |
| Guatemalans | 0.0 /100 | #320 | Tragic 3.0% |
| Mexicans | 0.0 /100 | #321 | Tragic 3.0% |
| Immigrants | Guatemala | 0.0 /100 | #322 | Tragic 3.0% |
| Immigrants | Central America | 0.0 /100 | #323 | Tragic 3.0% |
| Fijians | 0.0 /100 | #324 | Tragic 3.0% |
| Immigrants | Mexico | 0.0 /100 | #325 | Tragic 3.0% |
| Aleuts | 0.0 /100 | #326 | Tragic 3.0% |
| Bangladeshis | 0.0 /100 | #327 | Tragic 3.1% |
| Immigrants | Cabo Verde | 0.0 /100 | #328 | Tragic 3.1% |
| Chippewa | 0.0 /100 | #329 | Tragic 3.1% |
| Nepalese | 0.0 /100 | #330 | Tragic 3.1% |
| Navajo | 0.0 /100 | #331 | Tragic 3.2% |
Demographics Similar to Immigrants from England by Single Father Households
In terms of single father households, the demographic groups most similar to Immigrants from England are Serbian (2.2%, a difference of 0.010%), Jordanian (2.2%, a difference of 0.040%), Moroccan (2.2%, a difference of 0.050%), Immigrants from Chile (2.2%, a difference of 0.12%), and Immigrants from Jordan (2.2%, a difference of 0.18%).
| Demographics | Rating | Rank | Single Father Households |
| Immigrants | Brazil | 97.7 /100 | #121 | Exceptional 2.2% |
| Immigrants | Iraq | 97.6 /100 | #122 | Exceptional 2.2% |
| Immigrants | Yemen | 97.5 /100 | #123 | Exceptional 2.2% |
| British West Indians | 97.4 /100 | #124 | Exceptional 2.2% |
| Immigrants | Indonesia | 97.4 /100 | #125 | Exceptional 2.2% |
| Moroccans | 96.9 /100 | #126 | Exceptional 2.2% |
| Jordanians | 96.9 /100 | #127 | Exceptional 2.2% |
| Immigrants | England | 96.8 /100 | #128 | Exceptional 2.2% |
| Serbians | 96.8 /100 | #129 | Exceptional 2.2% |
| Immigrants | Chile | 96.7 /100 | #130 | Exceptional 2.2% |
| Immigrants | Jordan | 96.6 /100 | #131 | Exceptional 2.2% |
| Poles | 96.5 /100 | #132 | Exceptional 2.2% |
| Taiwanese | 96.3 /100 | #133 | Exceptional 2.2% |
| Zimbabweans | 95.1 /100 | #134 | Exceptional 2.2% |
| Syrians | 94.8 /100 | #135 | Exceptional 2.2% |