Dutch vs Immigrants from Israel Births to Unmarried Women
COMPARE
Dutch
Immigrants from Israel
Births to Unmarried Women
Births to Unmarried Women Comparison
Dutch
Immigrants from Israel
31.5%
BIRTHS TO UNMARRIED WOMEN
55.3/ 100
METRIC RATING
167th/ 347
METRIC RANK
25.1%
BIRTHS TO UNMARRIED WOMEN
100.0/ 100
METRIC RATING
11th/ 347
METRIC RANK
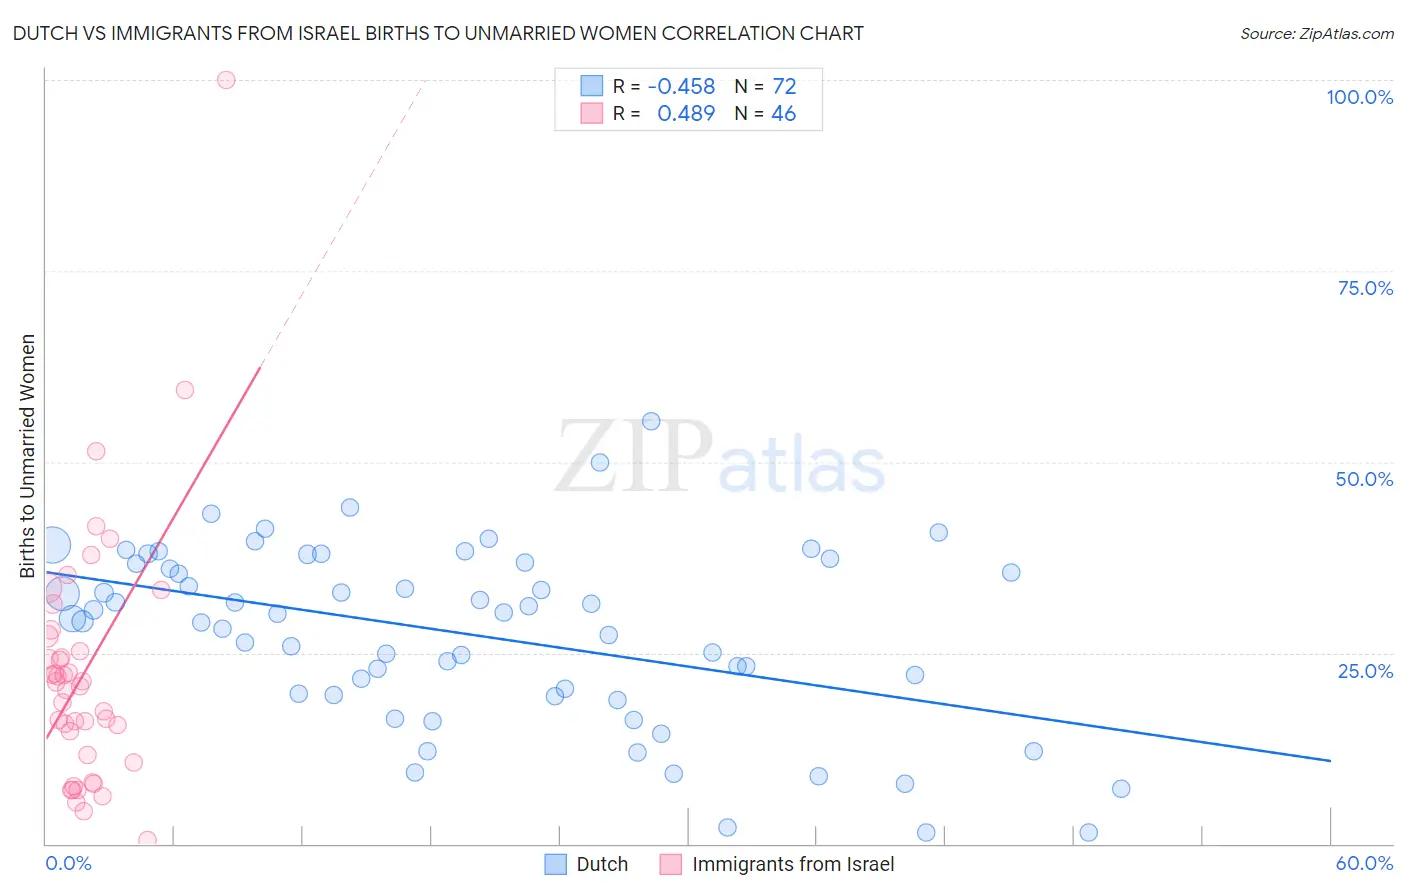
Dutch vs Immigrants from Israel Births to Unmarried Women Correlation Chart
The statistical analysis conducted on geographies consisting of 493,194,115 people shows a moderate negative correlation between the proportion of Dutch and percentage of births to unmarried women in the United States with a correlation coefficient (R) of -0.458 and weighted average of 31.5%. Similarly, the statistical analysis conducted on geographies consisting of 198,005,914 people shows a moderate positive correlation between the proportion of Immigrants from Israel and percentage of births to unmarried women in the United States with a correlation coefficient (R) of 0.489 and weighted average of 25.1%, a difference of 25.3%.
Births to Unmarried Women Correlation Summary
| Measurement | Dutch | Immigrants from Israel |
| Minimum | 1.4% | 0.50% |
| Maximum | 55.3% | 100.0% |
| Range | 53.9% | 99.5% |
| Mean | 27.5% | 22.6% |
| Median | 29.8% | 20.9% |
| Interquartile 25% (IQ1) | 19.6% | 11.6% |
| Interquartile 75% (IQ3) | 36.7% | 27.2% |
| Interquartile Range (IQR) | 17.2% | 15.6% |
| Standard Deviation (Sample) | 11.7% | 17.0% |
| Standard Deviation (Population) | 11.6% | 16.8% |
Similar Demographics by Births to Unmarried Women
Demographics Similar to Dutch by Births to Unmarried Women
In terms of births to unmarried women, the demographic groups most similar to Dutch are Peruvian (31.5%, a difference of 0.030%), Belgian (31.6%, a difference of 0.27%), Immigrants from Somalia (31.4%, a difference of 0.28%), Slavic (31.6%, a difference of 0.31%), and Guamanian/Chamorro (31.6%, a difference of 0.38%).
| Demographics | Rating | Rank | Births to Unmarried Women |
| Immigrants | Western Europe | 69.3 /100 | #160 | Good 31.1% |
| Immigrants | Southern Europe | 68.7 /100 | #161 | Good 31.1% |
| Slovenes | 65.9 /100 | #162 | Good 31.2% |
| Immigrants | Chile | 65.7 /100 | #163 | Good 31.2% |
| Hungarians | 64.1 /100 | #164 | Good 31.2% |
| Immigrants | Somalia | 58.1 /100 | #165 | Average 31.4% |
| Peruvians | 55.5 /100 | #166 | Average 31.5% |
| Dutch | 55.3 /100 | #167 | Average 31.5% |
| Belgians | 52.4 /100 | #168 | Average 31.6% |
| Slavs | 52.0 /100 | #169 | Average 31.6% |
| Guamanians/Chamorros | 51.3 /100 | #170 | Average 31.6% |
| Finns | 50.5 /100 | #171 | Average 31.7% |
| Immigrants | Eritrea | 50.4 /100 | #172 | Average 31.7% |
| Immigrants | Yemen | 50.2 /100 | #173 | Average 31.7% |
| Venezuelans | 50.0 /100 | #174 | Average 31.7% |
Demographics Similar to Immigrants from Israel by Births to Unmarried Women
In terms of births to unmarried women, the demographic groups most similar to Immigrants from Israel are Immigrants from Eastern Asia (25.0%, a difference of 0.42%), Indian (Asian) (25.3%, a difference of 0.47%), Iranian (25.3%, a difference of 0.61%), Immigrants from Lebanon (25.3%, a difference of 0.73%), and Immigrants from South Central Asia (24.7%, a difference of 1.9%).
| Demographics | Rating | Rank | Births to Unmarried Women |
| Immigrants | Taiwan | 100.0 /100 | #4 | Exceptional 23.0% |
| Immigrants | Hong Kong | 100.0 /100 | #5 | Exceptional 23.6% |
| Immigrants | Iran | 100.0 /100 | #6 | Exceptional 24.0% |
| Thais | 100.0 /100 | #7 | Exceptional 24.0% |
| Immigrants | China | 100.0 /100 | #8 | Exceptional 24.7% |
| Immigrants | South Central Asia | 100.0 /100 | #9 | Exceptional 24.7% |
| Immigrants | Eastern Asia | 100.0 /100 | #10 | Exceptional 25.0% |
| Immigrants | Israel | 100.0 /100 | #11 | Exceptional 25.1% |
| Indians (Asian) | 100.0 /100 | #12 | Exceptional 25.3% |
| Iranians | 100.0 /100 | #13 | Exceptional 25.3% |
| Immigrants | Lebanon | 100.0 /100 | #14 | Exceptional 25.3% |
| Immigrants | Singapore | 100.0 /100 | #15 | Exceptional 25.6% |
| Immigrants | Belarus | 100.0 /100 | #16 | Exceptional 25.6% |
| Immigrants | Uzbekistan | 100.0 /100 | #17 | Exceptional 25.8% |
| Immigrants | Armenia | 99.9 /100 | #18 | Exceptional 26.1% |