Dutch vs Guamanian/Chamorro Divorced or Separated
COMPARE
Dutch
Guamanian/Chamorro
Divorced or Separated
Divorced or Separated Comparison
Dutch
Guamanians/Chamorros
12.4%
DIVORCED OR SEPARATED
3.1/ 100
METRIC RATING
242nd/ 347
METRIC RANK
12.3%
DIVORCED OR SEPARATED
11.3/ 100
METRIC RATING
221st/ 347
METRIC RANK
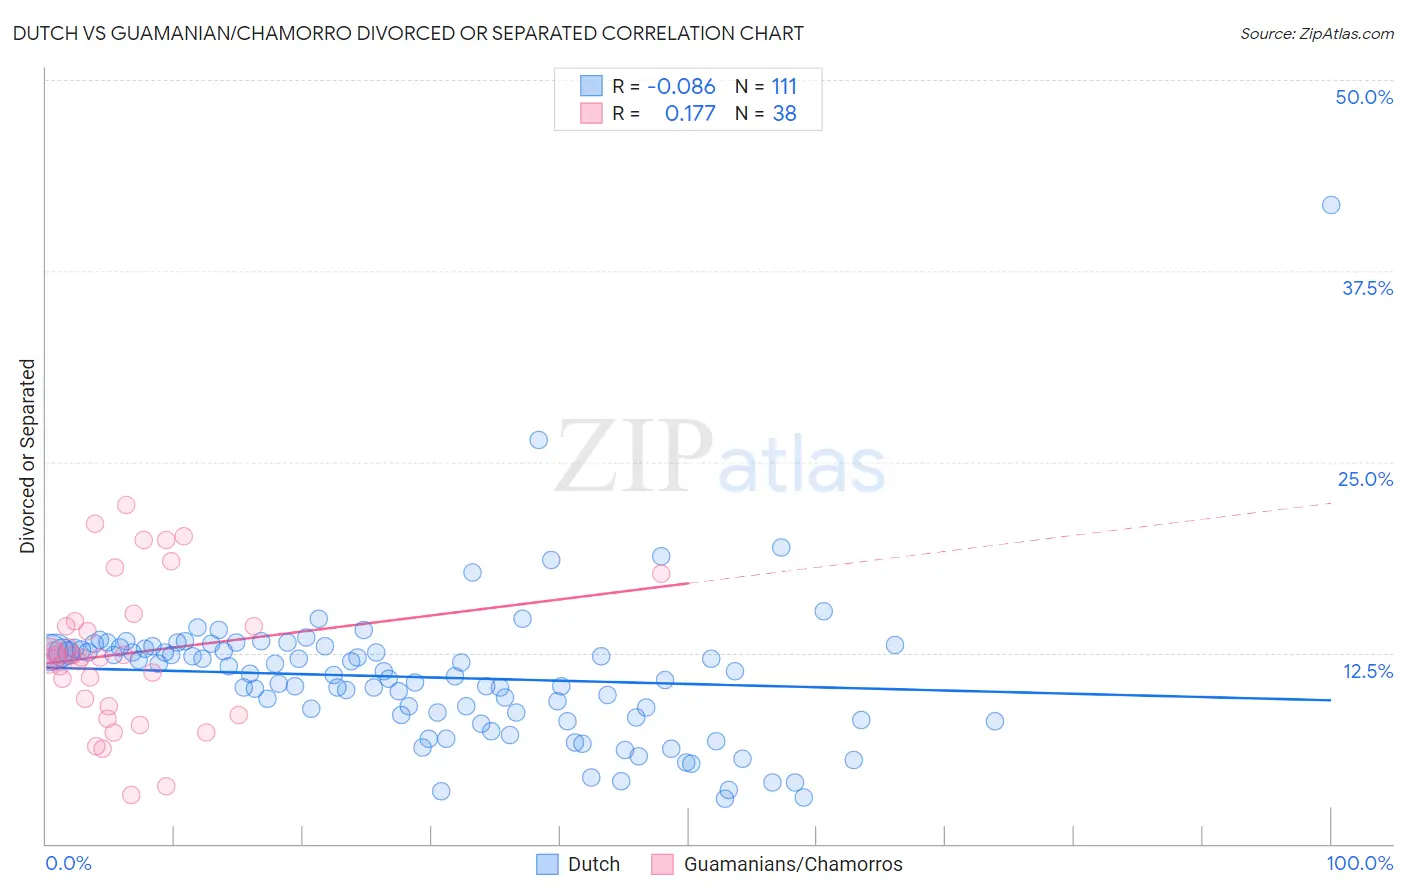
Dutch vs Guamanian/Chamorro Divorced or Separated Correlation Chart
The statistical analysis conducted on geographies consisting of 553,980,787 people shows a slight negative correlation between the proportion of Dutch and percentage of population currently divorced or separated in the United States with a correlation coefficient (R) of -0.086 and weighted average of 12.4%. Similarly, the statistical analysis conducted on geographies consisting of 221,943,719 people shows a poor positive correlation between the proportion of Guamanians/Chamorros and percentage of population currently divorced or separated in the United States with a correlation coefficient (R) of 0.177 and weighted average of 12.3%, a difference of 1.2%.
Divorced or Separated Correlation Summary
| Measurement | Dutch | Guamanian/Chamorro |
| Minimum | 3.0% | 3.2% |
| Maximum | 41.8% | 22.2% |
| Range | 38.9% | 19.0% |
| Mean | 10.9% | 12.5% |
| Median | 11.1% | 12.2% |
| Interquartile 25% (IQ1) | 8.3% | 9.0% |
| Interquartile 75% (IQ3) | 12.8% | 14.6% |
| Interquartile Range (IQR) | 4.5% | 5.6% |
| Standard Deviation (Sample) | 4.7% | 4.7% |
| Standard Deviation (Population) | 4.7% | 4.7% |
Similar Demographics by Divorced or Separated
Demographics Similar to Dutch by Divorced or Separated
In terms of divorced or separated, the demographic groups most similar to Dutch are Immigrants from Latin America (12.4%, a difference of 0.070%), Uruguayan (12.4%, a difference of 0.090%), British West Indian (12.4%, a difference of 0.17%), Alaska Native (12.4%, a difference of 0.17%), and Immigrants from Germany (12.4%, a difference of 0.23%).
| Demographics | Rating | Rank | Divorced or Separated |
| Immigrants | Bosnia and Herzegovina | 4.3 /100 | #235 | Tragic 12.4% |
| Colombians | 4.2 /100 | #236 | Tragic 12.4% |
| Immigrants | Laos | 4.2 /100 | #237 | Tragic 12.4% |
| Sudanese | 4.0 /100 | #238 | Tragic 12.4% |
| Immigrants | Germany | 4.0 /100 | #239 | Tragic 12.4% |
| British West Indians | 3.7 /100 | #240 | Tragic 12.4% |
| Uruguayans | 3.4 /100 | #241 | Tragic 12.4% |
| Dutch | 3.1 /100 | #242 | Tragic 12.4% |
| Immigrants | Latin America | 2.8 /100 | #243 | Tragic 12.4% |
| Alaska Natives | 2.5 /100 | #244 | Tragic 12.4% |
| Hispanics or Latinos | 2.0 /100 | #245 | Tragic 12.5% |
| Immigrants | West Indies | 1.9 /100 | #246 | Tragic 12.5% |
| Germans | 1.8 /100 | #247 | Tragic 12.5% |
| Nepalese | 1.8 /100 | #248 | Tragic 12.5% |
| Finns | 1.8 /100 | #249 | Tragic 12.5% |
Demographics Similar to Guamanians/Chamorros by Divorced or Separated
In terms of divorced or separated, the demographic groups most similar to Guamanians/Chamorros are Czechoslovakian (12.3%, a difference of 0.030%), British (12.3%, a difference of 0.030%), Bangladeshi (12.3%, a difference of 0.070%), Scandinavian (12.3%, a difference of 0.080%), and Slovene (12.3%, a difference of 0.15%).
| Demographics | Rating | Rank | Divorced or Separated |
| Immigrants | Argentina | 15.5 /100 | #214 | Poor 12.2% |
| Europeans | 15.4 /100 | #215 | Poor 12.2% |
| Immigrants | South America | 15.4 /100 | #216 | Poor 12.2% |
| Northern Europeans | 14.7 /100 | #217 | Poor 12.2% |
| Slovenes | 13.2 /100 | #218 | Poor 12.3% |
| Czechoslovakians | 11.7 /100 | #219 | Poor 12.3% |
| British | 11.6 /100 | #220 | Poor 12.3% |
| Guamanians/Chamorros | 11.3 /100 | #221 | Poor 12.3% |
| Bangladeshis | 10.5 /100 | #222 | Poor 12.3% |
| Scandinavians | 10.4 /100 | #223 | Poor 12.3% |
| Immigrants | Azores | 9.7 /100 | #224 | Tragic 12.3% |
| Belgians | 9.7 /100 | #225 | Tragic 12.3% |
| Immigrants | Western Africa | 9.3 /100 | #226 | Tragic 12.3% |
| Hmong | 8.8 /100 | #227 | Tragic 12.3% |
| Immigrants | Cameroon | 8.3 /100 | #228 | Tragic 12.3% |