Cypriot vs Honduran Single Father Households
COMPARE
Cypriot
Honduran
Single Father Households
Single Father Households Comparison
Cypriots
Hondurans
1.8%
SINGLE FATHER HOUSEHOLDS
100.0/ 100
METRIC RATING
7th/ 347
METRIC RANK
2.8%
SINGLE FATHER HOUSEHOLDS
0.0/ 100
METRIC RATING
297th/ 347
METRIC RANK
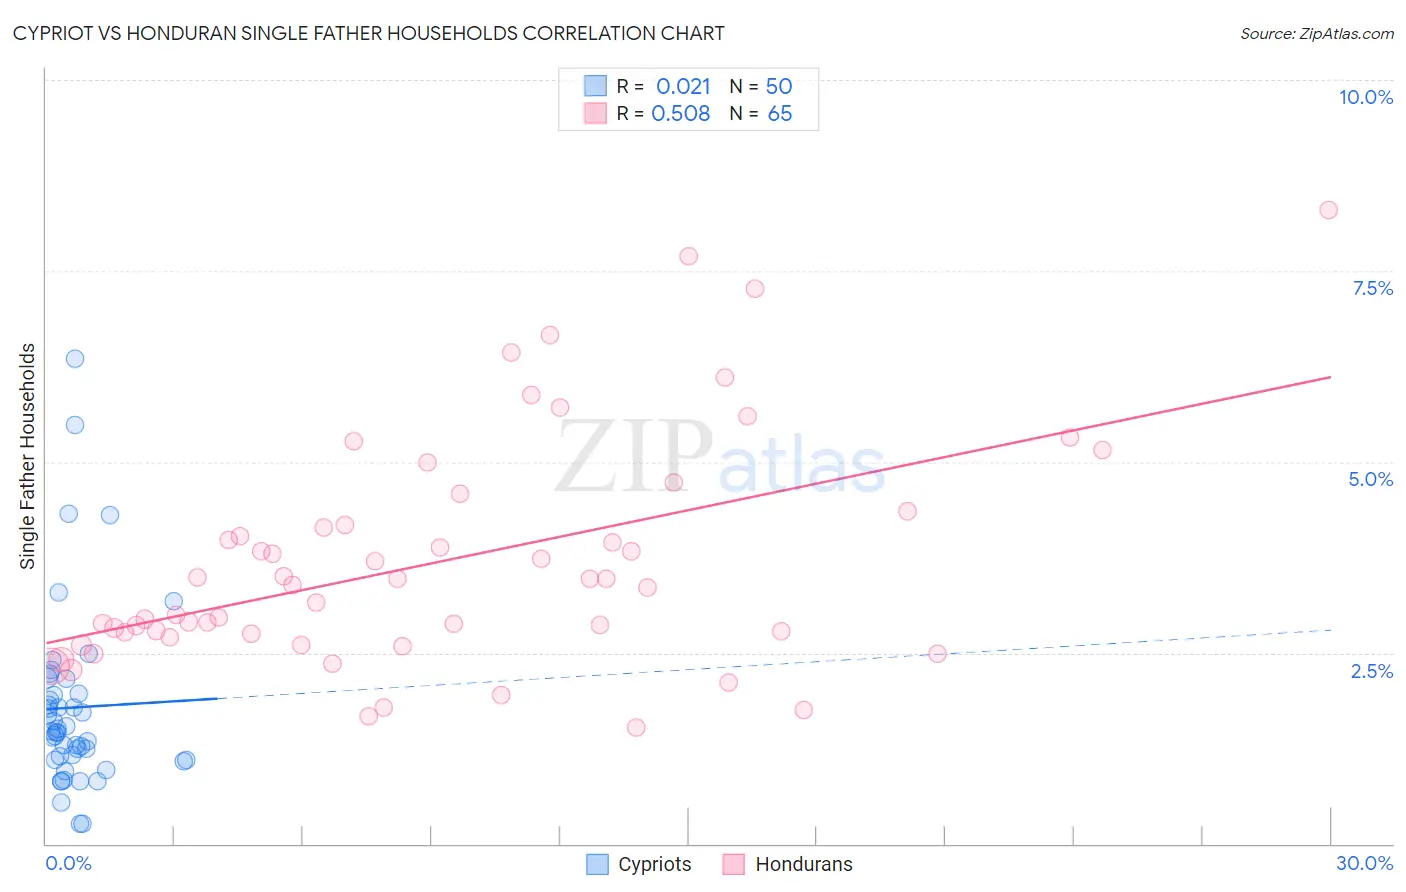
Cypriot vs Honduran Single Father Households Correlation Chart
The statistical analysis conducted on geographies consisting of 61,632,600 people shows no correlation between the proportion of Cypriots and percentage of single father households in the United States with a correlation coefficient (R) of 0.021 and weighted average of 1.8%. Similarly, the statistical analysis conducted on geographies consisting of 355,602,571 people shows a substantial positive correlation between the proportion of Hondurans and percentage of single father households in the United States with a correlation coefficient (R) of 0.508 and weighted average of 2.8%, a difference of 49.6%.
Single Father Households Correlation Summary
| Measurement | Cypriot | Honduran |
| Minimum | 0.26% | 1.5% |
| Maximum | 6.4% | 8.3% |
| Range | 6.1% | 6.8% |
| Mean | 1.8% | 3.7% |
| Median | 1.5% | 3.4% |
| Interquartile 25% (IQ1) | 1.1% | 2.7% |
| Interquartile 75% (IQ3) | 2.0% | 4.3% |
| Interquartile Range (IQR) | 0.87% | 1.5% |
| Standard Deviation (Sample) | 1.2% | 1.5% |
| Standard Deviation (Population) | 1.2% | 1.5% |
Similar Demographics by Single Father Households
Demographics Similar to Cypriots by Single Father Households
In terms of single father households, the demographic groups most similar to Cypriots are Immigrants from Ireland (1.8%, a difference of 0.11%), Immigrants from Taiwan (1.8%, a difference of 0.16%), Immigrants from China (1.8%, a difference of 0.25%), Immigrants from Hong Kong (1.8%, a difference of 0.52%), and Okinawan (1.9%, a difference of 0.61%).
| Demographics | Rating | Rank | Single Father Households |
| Soviet Union | 100.0 /100 | #1 | Exceptional 1.8% |
| Immigrants | Israel | 100.0 /100 | #2 | Exceptional 1.8% |
| Filipinos | 100.0 /100 | #3 | Exceptional 1.8% |
| Immigrants | Uzbekistan | 100.0 /100 | #4 | Exceptional 1.8% |
| Immigrants | Hong Kong | 100.0 /100 | #5 | Exceptional 1.8% |
| Immigrants | Taiwan | 100.0 /100 | #6 | Exceptional 1.8% |
| Cypriots | 100.0 /100 | #7 | Exceptional 1.8% |
| Immigrants | Ireland | 100.0 /100 | #8 | Exceptional 1.8% |
| Immigrants | China | 100.0 /100 | #9 | Exceptional 1.8% |
| Okinawans | 100.0 /100 | #10 | Exceptional 1.9% |
| Immigrants | Belarus | 100.0 /100 | #11 | Exceptional 1.9% |
| Immigrants | Greece | 100.0 /100 | #12 | Exceptional 1.9% |
| Immigrants | Singapore | 100.0 /100 | #13 | Exceptional 1.9% |
| Immigrants | Lithuania | 100.0 /100 | #14 | Exceptional 1.9% |
| Immigrants | Eastern Asia | 100.0 /100 | #15 | Exceptional 1.9% |
Demographics Similar to Hondurans by Single Father Households
In terms of single father households, the demographic groups most similar to Hondurans are Japanese (2.8%, a difference of 0.080%), Chickasaw (2.8%, a difference of 0.10%), Cree (2.8%, a difference of 0.49%), Lumbee (2.8%, a difference of 0.87%), and Malaysian (2.7%, a difference of 0.91%).
| Demographics | Rating | Rank | Single Father Households |
| Puget Sound Salish | 0.0 /100 | #290 | Tragic 2.7% |
| Blackfeet | 0.0 /100 | #291 | Tragic 2.7% |
| Choctaw | 0.0 /100 | #292 | Tragic 2.7% |
| Immigrants | Fiji | 0.0 /100 | #293 | Tragic 2.7% |
| Malaysians | 0.0 /100 | #294 | Tragic 2.7% |
| Chickasaw | 0.0 /100 | #295 | Tragic 2.8% |
| Japanese | 0.0 /100 | #296 | Tragic 2.8% |
| Hondurans | 0.0 /100 | #297 | Tragic 2.8% |
| Cree | 0.0 /100 | #298 | Tragic 2.8% |
| Lumbee | 0.0 /100 | #299 | Tragic 2.8% |
| Kiowa | 0.0 /100 | #300 | Tragic 2.8% |
| Immigrants | Latin America | 0.0 /100 | #301 | Tragic 2.8% |
| Spanish Americans | 0.0 /100 | #302 | Tragic 2.8% |
| Immigrants | Honduras | 0.0 /100 | #303 | Tragic 2.8% |
| Mexican American Indians | 0.0 /100 | #304 | Tragic 2.8% |