Costa Rican vs Salvadoran Single Father Households
COMPARE
Costa Rican
Salvadoran
Single Father Households
Single Father Households Comparison
Costa Ricans
Salvadorans
2.3%
SINGLE FATHER HOUSEHOLDS
44.1/ 100
METRIC RATING
178th/ 347
METRIC RANK
2.9%
SINGLE FATHER HOUSEHOLDS
0.0/ 100
METRIC RATING
314th/ 347
METRIC RANK
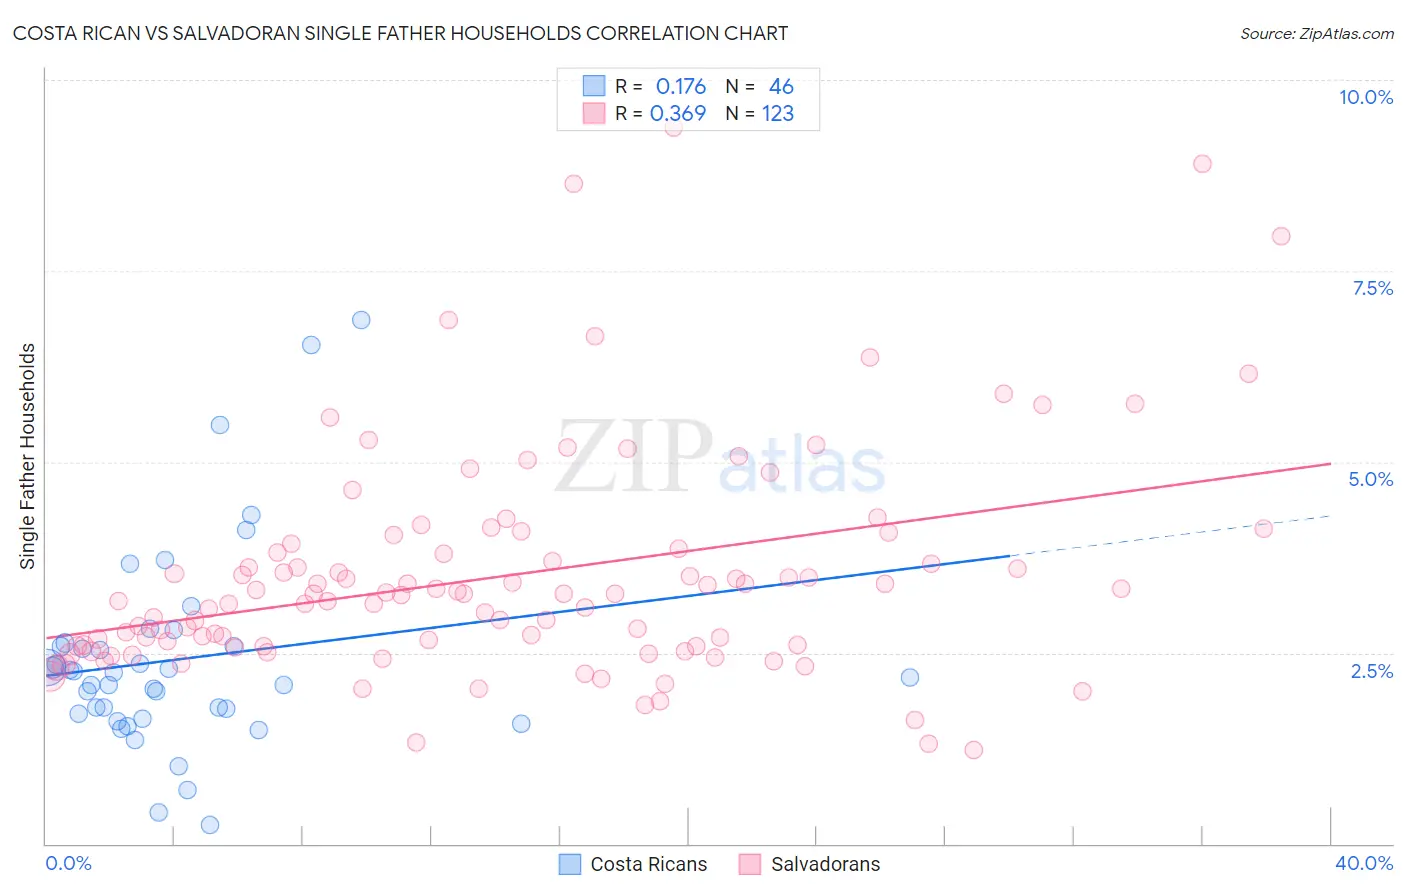
Costa Rican vs Salvadoran Single Father Households Correlation Chart
The statistical analysis conducted on geographies consisting of 252,556,792 people shows a poor positive correlation between the proportion of Costa Ricans and percentage of single father households in the United States with a correlation coefficient (R) of 0.176 and weighted average of 2.3%. Similarly, the statistical analysis conducted on geographies consisting of 395,913,017 people shows a mild positive correlation between the proportion of Salvadorans and percentage of single father households in the United States with a correlation coefficient (R) of 0.369 and weighted average of 2.9%, a difference of 23.9%.
Single Father Households Correlation Summary
| Measurement | Costa Rican | Salvadoran |
| Minimum | 0.25% | 1.2% |
| Maximum | 6.9% | 9.4% |
| Range | 6.6% | 8.1% |
| Mean | 2.4% | 3.5% |
| Median | 2.2% | 3.3% |
| Interquartile 25% (IQ1) | 1.7% | 2.6% |
| Interquartile 75% (IQ3) | 2.6% | 3.9% |
| Interquartile Range (IQR) | 0.87% | 1.3% |
| Standard Deviation (Sample) | 1.3% | 1.5% |
| Standard Deviation (Population) | 1.3% | 1.5% |
Similar Demographics by Single Father Households
Demographics Similar to Costa Ricans by Single Father Households
In terms of single father households, the demographic groups most similar to Costa Ricans are Welsh (2.3%, a difference of 0.0%), Yugoslavian (2.3%, a difference of 0.020%), Jamaican (2.3%, a difference of 0.040%), Belgian (2.3%, a difference of 0.060%), and Immigrants from Panama (2.4%, a difference of 0.17%).
| Demographics | Rating | Rank | Single Father Households |
| Swedes | 61.6 /100 | #171 | Good 2.3% |
| Czechoslovakians | 58.9 /100 | #172 | Average 2.3% |
| Celtics | 55.4 /100 | #173 | Average 2.3% |
| Afghans | 50.0 /100 | #174 | Average 2.3% |
| Immigrants | Jamaica | 49.1 /100 | #175 | Average 2.3% |
| Danes | 48.2 /100 | #176 | Average 2.3% |
| Colombians | 48.0 /100 | #177 | Average 2.3% |
| Costa Ricans | 44.1 /100 | #178 | Average 2.3% |
| Welsh | 44.0 /100 | #179 | Average 2.3% |
| Yugoslavians | 43.9 /100 | #180 | Average 2.3% |
| Jamaicans | 43.5 /100 | #181 | Average 2.3% |
| Belgians | 43.3 /100 | #182 | Average 2.3% |
| Immigrants | Panama | 41.8 /100 | #183 | Average 2.4% |
| Sri Lankans | 41.8 /100 | #184 | Average 2.4% |
| Nigerians | 41.0 /100 | #185 | Average 2.4% |
Demographics Similar to Salvadorans by Single Father Households
In terms of single father households, the demographic groups most similar to Salvadorans are Arapaho (2.9%, a difference of 0.25%), Cheyenne (2.9%, a difference of 0.39%), Houma (2.9%, a difference of 0.39%), Tsimshian (2.9%, a difference of 0.67%), and Spanish American Indian (2.9%, a difference of 1.2%).
| Demographics | Rating | Rank | Single Father Households |
| Hopi | 0.0 /100 | #307 | Tragic 2.8% |
| Apache | 0.0 /100 | #308 | Tragic 2.8% |
| Central Americans | 0.0 /100 | #309 | Tragic 2.9% |
| Immigrants | Laos | 0.0 /100 | #310 | Tragic 2.9% |
| Spanish American Indians | 0.0 /100 | #311 | Tragic 2.9% |
| Tsimshian | 0.0 /100 | #312 | Tragic 2.9% |
| Arapaho | 0.0 /100 | #313 | Tragic 2.9% |
| Salvadorans | 0.0 /100 | #314 | Tragic 2.9% |
| Cheyenne | 0.0 /100 | #315 | Tragic 2.9% |
| Houma | 0.0 /100 | #316 | Tragic 2.9% |
| Immigrants | El Salvador | 0.0 /100 | #317 | Tragic 2.9% |
| Cape Verdeans | 0.0 /100 | #318 | Tragic 2.9% |
| Ute | 0.0 /100 | #319 | Tragic 3.0% |
| Guatemalans | 0.0 /100 | #320 | Tragic 3.0% |
| Mexicans | 0.0 /100 | #321 | Tragic 3.0% |