Costa Rican vs Okinawan Divorced or Separated
COMPARE
Costa Rican
Okinawan
Divorced or Separated
Divorced or Separated Comparison
Costa Ricans
Okinawans
12.0%
DIVORCED OR SEPARATED
53.3/ 100
METRIC RATING
171st/ 347
METRIC RANK
10.5%
DIVORCED OR SEPARATED
100.0/ 100
METRIC RATING
12th/ 347
METRIC RANK
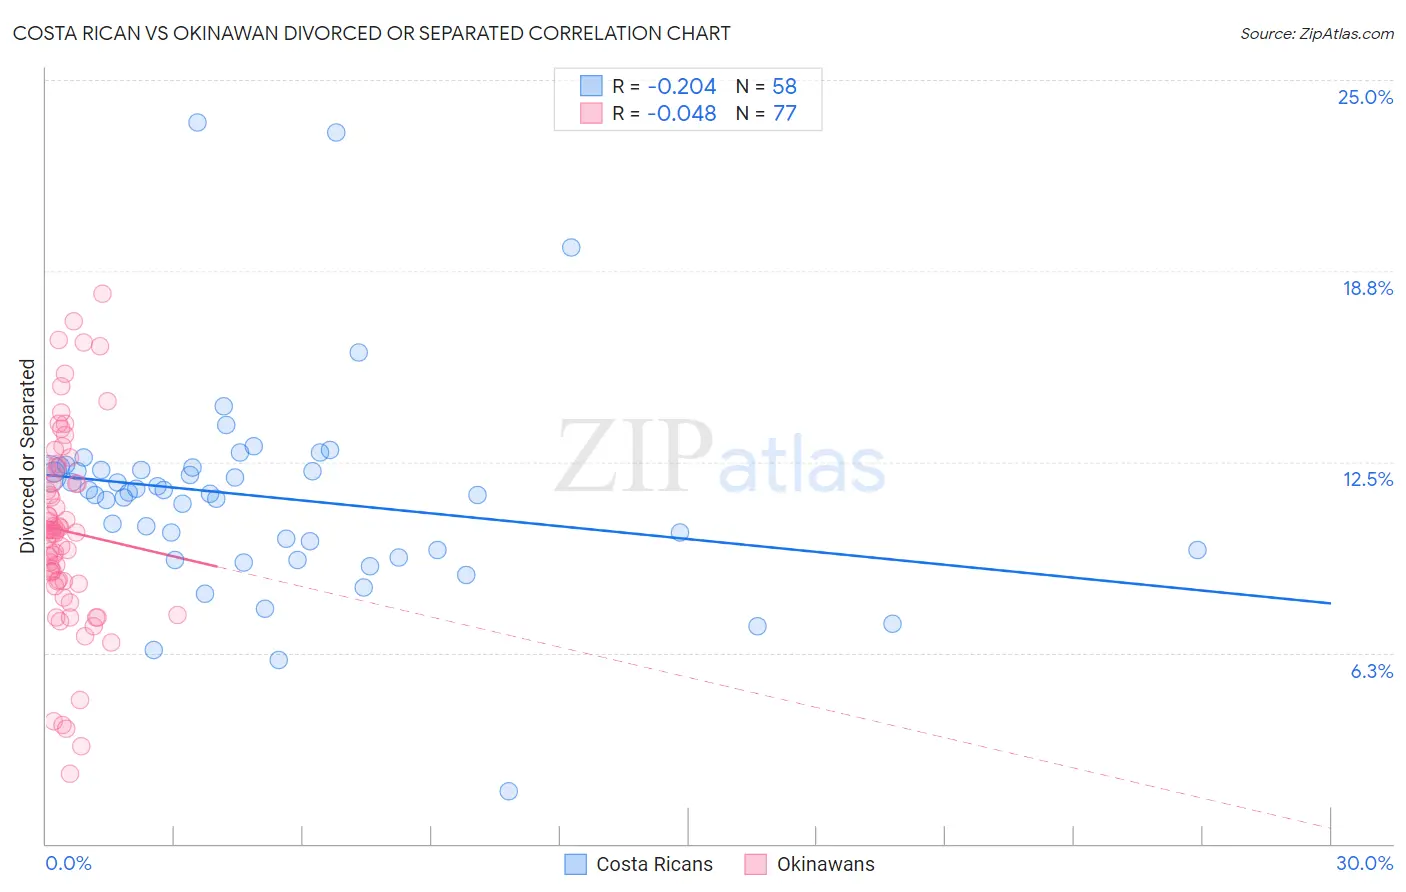
Costa Rican vs Okinawan Divorced or Separated Correlation Chart
The statistical analysis conducted on geographies consisting of 253,501,328 people shows a weak negative correlation between the proportion of Costa Ricans and percentage of population currently divorced or separated in the United States with a correlation coefficient (R) of -0.204 and weighted average of 12.0%. Similarly, the statistical analysis conducted on geographies consisting of 73,753,188 people shows no correlation between the proportion of Okinawans and percentage of population currently divorced or separated in the United States with a correlation coefficient (R) of -0.048 and weighted average of 10.5%, a difference of 15.0%.
Divorced or Separated Correlation Summary
| Measurement | Costa Rican | Okinawan |
| Minimum | 1.7% | 2.3% |
| Maximum | 23.6% | 18.0% |
| Range | 21.9% | 15.7% |
| Mean | 11.3% | 10.2% |
| Median | 11.5% | 10.3% |
| Interquartile 25% (IQ1) | 9.6% | 8.5% |
| Interquartile 75% (IQ3) | 12.2% | 12.2% |
| Interquartile Range (IQR) | 2.6% | 3.7% |
| Standard Deviation (Sample) | 3.4% | 3.2% |
| Standard Deviation (Population) | 3.4% | 3.2% |
Similar Demographics by Divorced or Separated
Demographics Similar to Costa Ricans by Divorced or Separated
In terms of divorced or separated, the demographic groups most similar to Costa Ricans are Immigrants from Mexico (12.0%, a difference of 0.010%), Mexican American Indian (12.0%, a difference of 0.090%), Immigrants from Moldova (12.1%, a difference of 0.10%), Hawaiian (12.1%, a difference of 0.12%), and Immigrants from Sierra Leone (12.1%, a difference of 0.12%).
| Demographics | Rating | Rank | Divorced or Separated |
| Swiss | 63.6 /100 | #164 | Good 12.0% |
| German Russians | 61.8 /100 | #165 | Good 12.0% |
| Tohono O'odham | 60.4 /100 | #166 | Good 12.0% |
| Ethiopians | 58.5 /100 | #167 | Average 12.0% |
| Serbians | 57.1 /100 | #168 | Average 12.0% |
| Immigrants | Peru | 57.0 /100 | #169 | Average 12.0% |
| Mexican American Indians | 55.8 /100 | #170 | Average 12.0% |
| Costa Ricans | 53.3 /100 | #171 | Average 12.0% |
| Immigrants | Mexico | 53.2 /100 | #172 | Average 12.0% |
| Immigrants | Moldova | 50.4 /100 | #173 | Average 12.1% |
| Hawaiians | 50.0 /100 | #174 | Average 12.1% |
| Immigrants | Sierra Leone | 50.0 /100 | #175 | Average 12.1% |
| Pennsylvania Germans | 48.9 /100 | #176 | Average 12.1% |
| Brazilians | 47.7 /100 | #177 | Average 12.1% |
| Ghanaians | 45.9 /100 | #178 | Average 12.1% |
Demographics Similar to Okinawans by Divorced or Separated
In terms of divorced or separated, the demographic groups most similar to Okinawans are Cypriot (10.5%, a difference of 0.16%), Immigrants from South Central Asia (10.4%, a difference of 0.34%), Assyrian/Chaldean/Syriac (10.6%, a difference of 0.90%), Immigrants from Armenia (10.6%, a difference of 0.97%), and Immigrants from Singapore (10.3%, a difference of 1.3%).
| Demographics | Rating | Rank | Divorced or Separated |
| Immigrants | India | 100.0 /100 | #5 | Exceptional 10.1% |
| Indians (Asian) | 100.0 /100 | #6 | Exceptional 10.2% |
| Thais | 100.0 /100 | #7 | Exceptional 10.2% |
| Immigrants | Eastern Asia | 100.0 /100 | #8 | Exceptional 10.2% |
| Yup'ik | 100.0 /100 | #9 | Exceptional 10.3% |
| Immigrants | Singapore | 100.0 /100 | #10 | Exceptional 10.3% |
| Immigrants | South Central Asia | 100.0 /100 | #11 | Exceptional 10.4% |
| Okinawans | 100.0 /100 | #12 | Exceptional 10.5% |
| Cypriots | 100.0 /100 | #13 | Exceptional 10.5% |
| Assyrians/Chaldeans/Syriacs | 100.0 /100 | #14 | Exceptional 10.6% |
| Immigrants | Armenia | 100.0 /100 | #15 | Exceptional 10.6% |
| Immigrants | Korea | 100.0 /100 | #16 | Exceptional 10.6% |
| Immigrants | Israel | 100.0 /100 | #17 | Exceptional 10.6% |
| Immigrants | Iran | 100.0 /100 | #18 | Exceptional 10.6% |
| Asians | 100.0 /100 | #19 | Exceptional 10.6% |