Cheyenne vs French American Indian Average Family Size
COMPARE
Cheyenne
French American Indian
Average Family Size
Average Family Size Comparison
Cheyenne
French American Indians
3.47
AVERAGE FAMILY SIZE
100.0/ 100
METRIC RATING
20th/ 347
METRIC RANK
3.20
AVERAGE FAMILY SIZE
9.8/ 100
METRIC RATING
218th/ 347
METRIC RANK
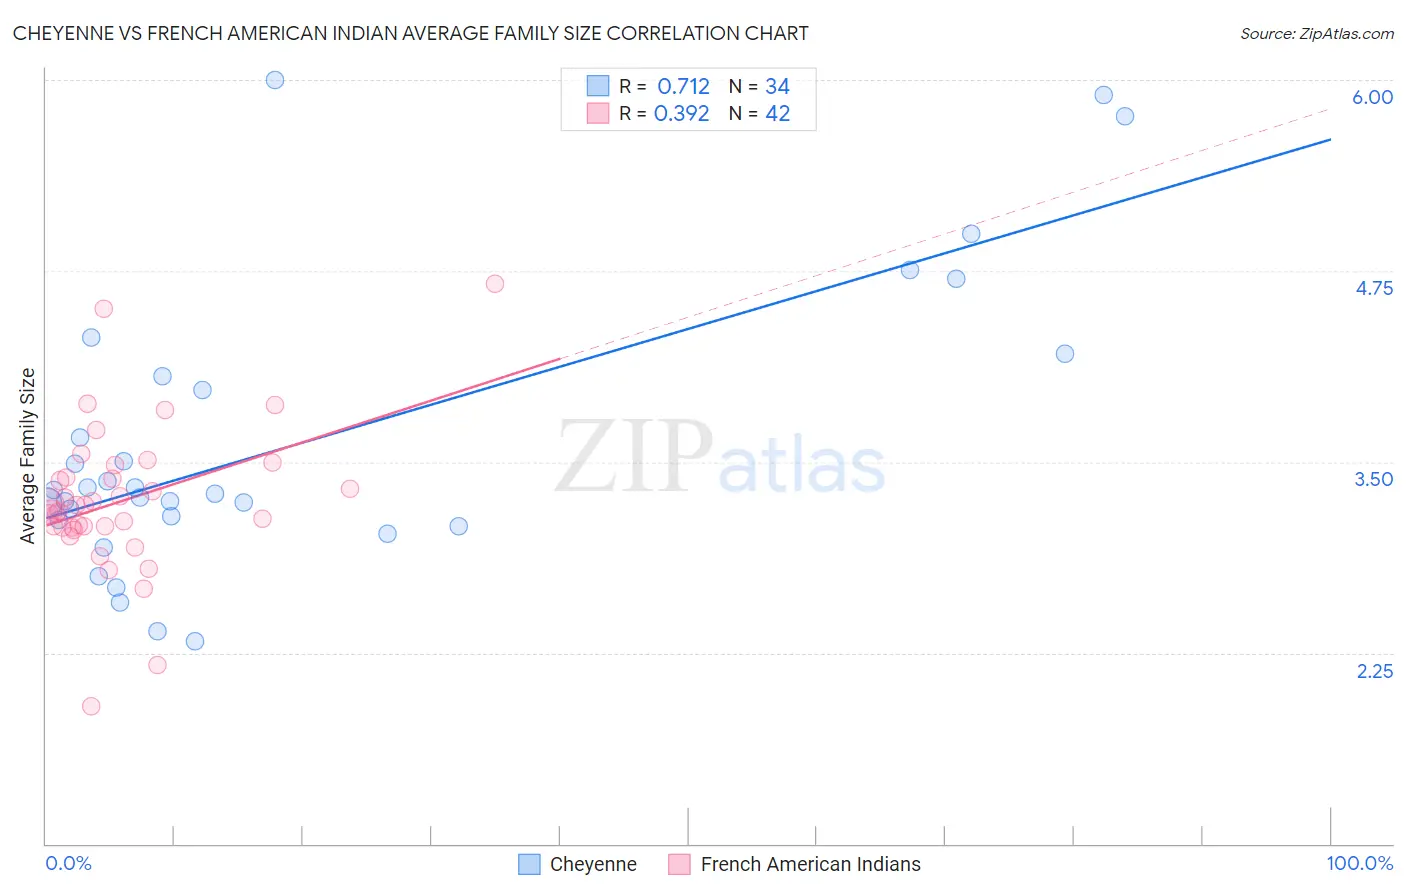
Cheyenne vs French American Indian Average Family Size Correlation Chart
The statistical analysis conducted on geographies consisting of 80,705,196 people shows a strong positive correlation between the proportion of Cheyenne and average family size in the United States with a correlation coefficient (R) of 0.712 and weighted average of 3.47. Similarly, the statistical analysis conducted on geographies consisting of 131,961,005 people shows a mild positive correlation between the proportion of French American Indians and average family size in the United States with a correlation coefficient (R) of 0.392 and weighted average of 3.20, a difference of 8.7%.
Average Family Size Correlation Summary
| Measurement | Cheyenne | French American Indian |
| Minimum | 2.33 | 1.90 |
| Maximum | 6.00 | 4.67 |
| Range | 3.67 | 2.77 |
| Mean | 3.63 | 3.25 |
| Median | 3.30 | 3.20 |
| Interquartile 25% (IQ1) | 3.12 | 3.07 |
| Interquartile 75% (IQ3) | 4.06 | 3.39 |
| Interquartile Range (IQR) | 0.94 | 0.33 |
| Standard Deviation (Sample) | 0.95 | 0.48 |
| Standard Deviation (Population) | 0.94 | 0.48 |
Similar Demographics by Average Family Size
Demographics Similar to Cheyenne by Average Family Size
In terms of average family size, the demographic groups most similar to Cheyenne are Mexican (3.48, a difference of 0.040%), Salvadoran (3.48, a difference of 0.11%), Yuman (3.47, a difference of 0.25%), Apache (3.46, a difference of 0.31%), and Immigrants from El Salvador (3.49, a difference of 0.36%).
| Demographics | Rating | Rank | Average Family Size |
| Sioux | 100.0 /100 | #13 | Exceptional 3.52 |
| Immigrants | Central America | 100.0 /100 | #14 | Exceptional 3.49 |
| Tongans | 100.0 /100 | #15 | Exceptional 3.49 |
| Ute | 100.0 /100 | #16 | Exceptional 3.49 |
| Immigrants | El Salvador | 100.0 /100 | #17 | Exceptional 3.49 |
| Salvadorans | 100.0 /100 | #18 | Exceptional 3.48 |
| Mexicans | 100.0 /100 | #19 | Exceptional 3.48 |
| Cheyenne | 100.0 /100 | #20 | Exceptional 3.47 |
| Yuman | 100.0 /100 | #21 | Exceptional 3.47 |
| Apache | 100.0 /100 | #22 | Exceptional 3.46 |
| Immigrants | Fiji | 100.0 /100 | #23 | Exceptional 3.45 |
| Natives/Alaskans | 100.0 /100 | #24 | Exceptional 3.45 |
| Yakama | 100.0 /100 | #25 | Exceptional 3.45 |
| Native Hawaiians | 100.0 /100 | #26 | Exceptional 3.43 |
| Mexican American Indians | 100.0 /100 | #27 | Exceptional 3.43 |
Demographics Similar to French American Indians by Average Family Size
In terms of average family size, the demographic groups most similar to French American Indians are Immigrants from Somalia (3.20, a difference of 0.030%), Pennsylvania German (3.19, a difference of 0.030%), Lebanese (3.19, a difference of 0.040%), Delaware (3.20, a difference of 0.060%), and Bermudan (3.20, a difference of 0.060%).
| Demographics | Rating | Rank | Average Family Size |
| Immigrants | Iran | 12.1 /100 | #211 | Poor 3.20 |
| Creek | 12.1 /100 | #212 | Poor 3.20 |
| Mongolians | 11.5 /100 | #213 | Poor 3.20 |
| Somalis | 11.2 /100 | #214 | Poor 3.20 |
| Delaware | 11.1 /100 | #215 | Poor 3.20 |
| Bermudans | 11.0 /100 | #216 | Poor 3.20 |
| Immigrants | Somalia | 10.3 /100 | #217 | Poor 3.20 |
| French American Indians | 9.8 /100 | #218 | Tragic 3.20 |
| Pennsylvania Germans | 9.3 /100 | #219 | Tragic 3.19 |
| Lebanese | 9.1 /100 | #220 | Tragic 3.19 |
| Immigrants | Ukraine | 7.2 /100 | #221 | Tragic 3.19 |
| Immigrants | Kuwait | 7.2 /100 | #222 | Tragic 3.19 |
| Immigrants | Zimbabwe | 7.1 /100 | #223 | Tragic 3.19 |
| Syrians | 6.5 /100 | #224 | Tragic 3.19 |
| Cree | 6.2 /100 | #225 | Tragic 3.19 |