Central American vs Immigrants from Ghana Single Mother Households
COMPARE
Central American
Immigrants from Ghana
Single Mother Households
Single Mother Households Comparison
Central Americans
Immigrants from Ghana
7.6%
SINGLE MOTHER HOUSEHOLDS
0.1/ 100
METRIC RATING
278th/ 347
METRIC RANK
8.0%
SINGLE MOTHER HOUSEHOLDS
0.0/ 100
METRIC RATING
302nd/ 347
METRIC RANK
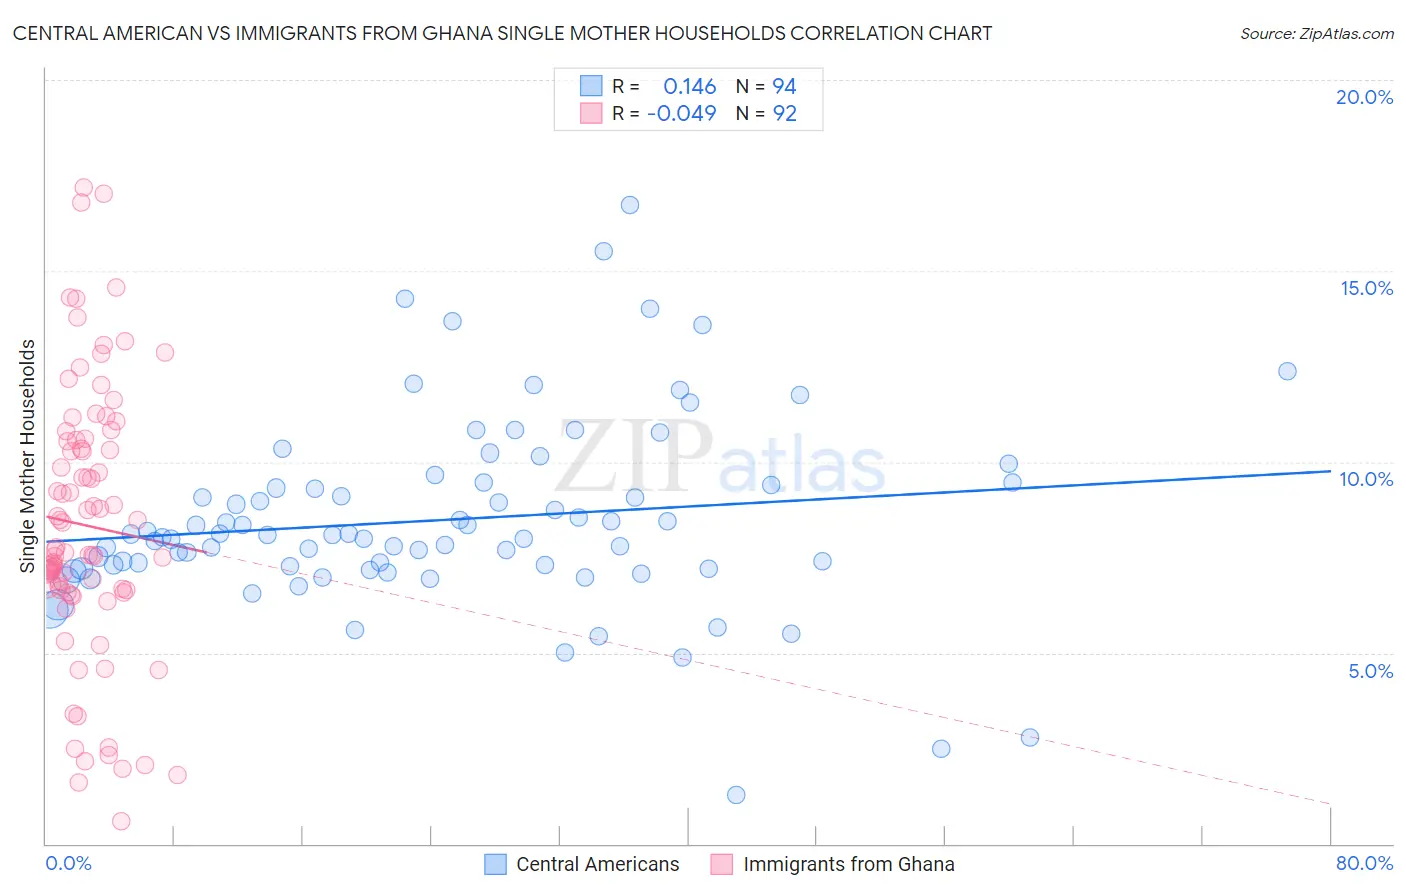
Central American vs Immigrants from Ghana Single Mother Households Correlation Chart
The statistical analysis conducted on geographies consisting of 502,537,291 people shows a poor positive correlation between the proportion of Central Americans and percentage of single mother households in the United States with a correlation coefficient (R) of 0.146 and weighted average of 7.6%. Similarly, the statistical analysis conducted on geographies consisting of 199,625,094 people shows no correlation between the proportion of Immigrants from Ghana and percentage of single mother households in the United States with a correlation coefficient (R) of -0.049 and weighted average of 8.0%, a difference of 5.0%.
Single Mother Households Correlation Summary
| Measurement | Central American | Immigrants from Ghana |
| Minimum | 1.3% | 0.60% |
| Maximum | 16.7% | 17.2% |
| Range | 15.5% | 16.6% |
| Mean | 8.5% | 8.3% |
| Median | 8.0% | 7.7% |
| Interquartile 25% (IQ1) | 7.2% | 6.6% |
| Interquartile 75% (IQ3) | 9.4% | 10.6% |
| Interquartile Range (IQR) | 2.2% | 3.9% |
| Standard Deviation (Sample) | 2.5% | 3.5% |
| Standard Deviation (Population) | 2.5% | 3.5% |
Similar Demographics by Single Mother Households
Demographics Similar to Central Americans by Single Mother Households
In terms of single mother households, the demographic groups most similar to Central Americans are Immigrants from Trinidad and Tobago (7.6%, a difference of 0.0%), Guyanese (7.6%, a difference of 0.050%), Immigrants from El Salvador (7.6%, a difference of 0.22%), Central American Indian (7.6%, a difference of 0.49%), and Immigrants from Guyana (7.6%, a difference of 0.59%).
| Demographics | Rating | Rank | Single Mother Households |
| Salvadorans | 0.1 /100 | #271 | Tragic 7.5% |
| Immigrants | Azores | 0.1 /100 | #272 | Tragic 7.5% |
| Belizeans | 0.1 /100 | #273 | Tragic 7.6% |
| Immigrants | Guyana | 0.1 /100 | #274 | Tragic 7.6% |
| Central American Indians | 0.1 /100 | #275 | Tragic 7.6% |
| Guyanese | 0.1 /100 | #276 | Tragic 7.6% |
| Immigrants | Trinidad and Tobago | 0.1 /100 | #277 | Tragic 7.6% |
| Central Americans | 0.1 /100 | #278 | Tragic 7.6% |
| Immigrants | El Salvador | 0.0 /100 | #279 | Tragic 7.6% |
| Immigrants | Sierra Leone | 0.0 /100 | #280 | Tragic 7.7% |
| Immigrants | Laos | 0.0 /100 | #281 | Tragic 7.7% |
| Guatemalans | 0.0 /100 | #282 | Tragic 7.7% |
| Nigerians | 0.0 /100 | #283 | Tragic 7.7% |
| Immigrants | Belize | 0.0 /100 | #284 | Tragic 7.7% |
| Trinidadians and Tobagonians | 0.0 /100 | #285 | Tragic 7.7% |
Demographics Similar to Immigrants from Ghana by Single Mother Households
In terms of single mother households, the demographic groups most similar to Immigrants from Ghana are Immigrants from Bahamas (8.0%, a difference of 0.020%), Chippewa (8.0%, a difference of 0.10%), Mexican (8.0%, a difference of 0.25%), Native/Alaskan (8.0%, a difference of 0.46%), and Colville (8.0%, a difference of 0.51%).
| Demographics | Rating | Rank | Single Mother Households |
| Barbadians | 0.0 /100 | #295 | Tragic 7.9% |
| Immigrants | Latin America | 0.0 /100 | #296 | Tragic 7.9% |
| Hispanics or Latinos | 0.0 /100 | #297 | Tragic 7.9% |
| Immigrants | West Indies | 0.0 /100 | #298 | Tragic 7.9% |
| Houma | 0.0 /100 | #299 | Tragic 7.9% |
| Mexicans | 0.0 /100 | #300 | Tragic 8.0% |
| Chippewa | 0.0 /100 | #301 | Tragic 8.0% |
| Immigrants | Ghana | 0.0 /100 | #302 | Tragic 8.0% |
| Immigrants | Bahamas | 0.0 /100 | #303 | Tragic 8.0% |
| Natives/Alaskans | 0.0 /100 | #304 | Tragic 8.0% |
| Colville | 0.0 /100 | #305 | Tragic 8.0% |
| Immigrants | Barbados | 0.0 /100 | #306 | Tragic 8.0% |
| Immigrants | St. Vincent and the Grenadines | 0.0 /100 | #307 | Tragic 8.0% |
| Immigrants | Central America | 0.0 /100 | #308 | Tragic 8.1% |
| Cheyenne | 0.0 /100 | #309 | Tragic 8.1% |