Central American Indian vs Filipino Single Mother Households
COMPARE
Central American Indian
Filipino
Single Mother Households
Single Mother Households Comparison
Central American Indians
Filipinos
7.6%
SINGLE MOTHER HOUSEHOLDS
0.1/ 100
METRIC RATING
275th/ 347
METRIC RANK
4.7%
SINGLE MOTHER HOUSEHOLDS
100.0/ 100
METRIC RATING
2nd/ 347
METRIC RANK
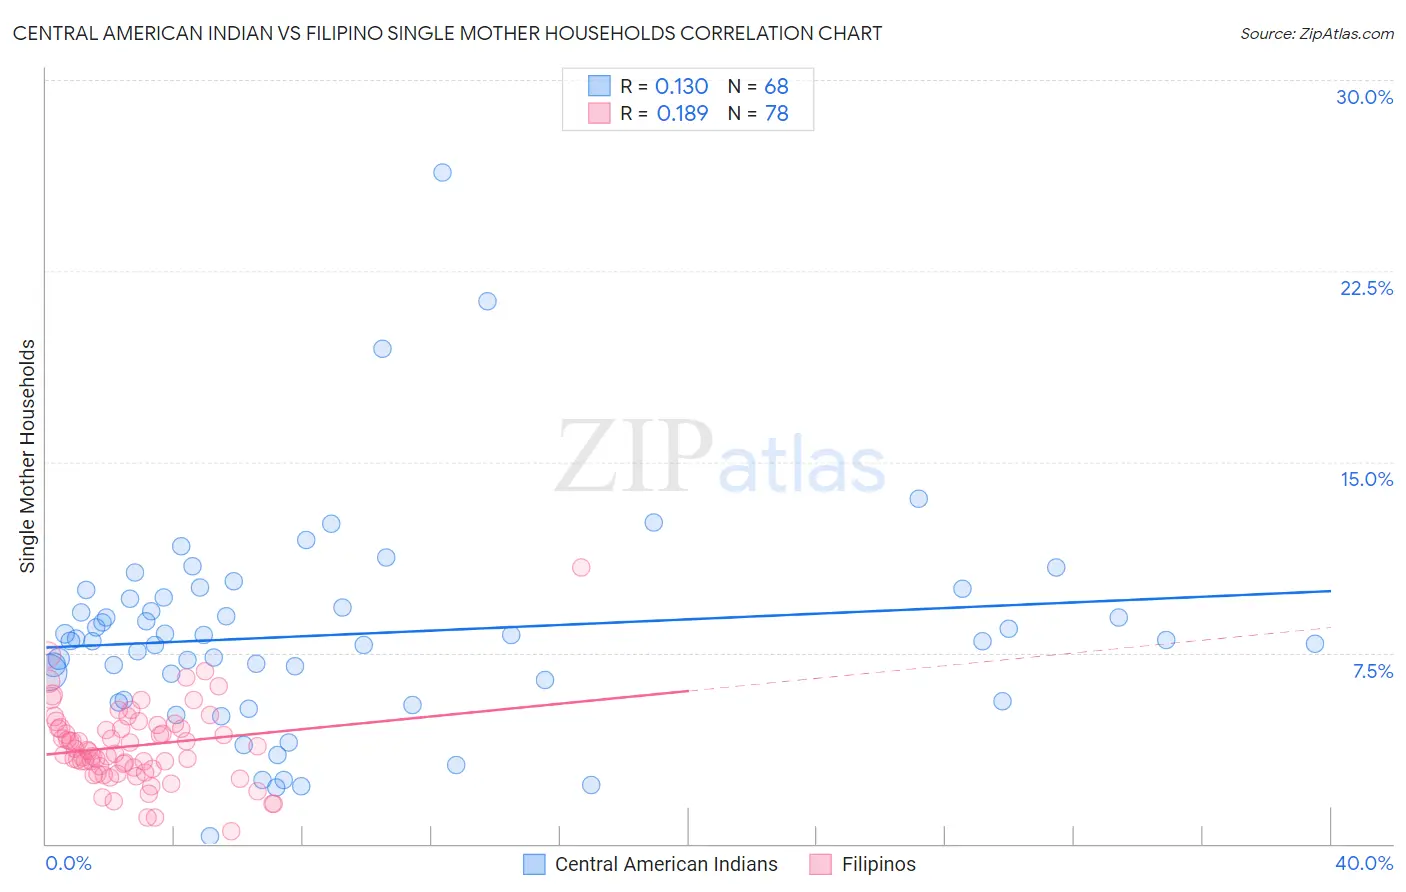
Central American Indian vs Filipino Single Mother Households Correlation Chart
The statistical analysis conducted on geographies consisting of 325,810,321 people shows a poor positive correlation between the proportion of Central American Indians and percentage of single mother households in the United States with a correlation coefficient (R) of 0.130 and weighted average of 7.6%. Similarly, the statistical analysis conducted on geographies consisting of 253,859,207 people shows a poor positive correlation between the proportion of Filipinos and percentage of single mother households in the United States with a correlation coefficient (R) of 0.189 and weighted average of 4.7%, a difference of 61.2%.
Single Mother Households Correlation Summary
| Measurement | Central American Indian | Filipino |
| Minimum | 0.29% | 0.51% |
| Maximum | 26.4% | 10.9% |
| Range | 26.1% | 10.4% |
| Mean | 8.2% | 3.8% |
| Median | 8.0% | 3.6% |
| Interquartile 25% (IQ1) | 6.0% | 2.9% |
| Interquartile 75% (IQ3) | 9.6% | 4.5% |
| Interquartile Range (IQR) | 3.6% | 1.6% |
| Standard Deviation (Sample) | 4.2% | 1.6% |
| Standard Deviation (Population) | 4.1% | 1.6% |
Similar Demographics by Single Mother Households
Demographics Similar to Central American Indians by Single Mother Households
In terms of single mother households, the demographic groups most similar to Central American Indians are Immigrants from Guyana (7.6%, a difference of 0.10%), Belizean (7.6%, a difference of 0.14%), Immigrants from the Azores (7.5%, a difference of 0.45%), Guyanese (7.6%, a difference of 0.45%), and Salvadoran (7.5%, a difference of 0.46%).
| Demographics | Rating | Rank | Single Mother Households |
| Indonesians | 0.1 /100 | #268 | Tragic 7.5% |
| Somalis | 0.1 /100 | #269 | Tragic 7.5% |
| Immigrants | Cuba | 0.1 /100 | #270 | Tragic 7.5% |
| Salvadorans | 0.1 /100 | #271 | Tragic 7.5% |
| Immigrants | Azores | 0.1 /100 | #272 | Tragic 7.5% |
| Belizeans | 0.1 /100 | #273 | Tragic 7.6% |
| Immigrants | Guyana | 0.1 /100 | #274 | Tragic 7.6% |
| Central American Indians | 0.1 /100 | #275 | Tragic 7.6% |
| Guyanese | 0.1 /100 | #276 | Tragic 7.6% |
| Immigrants | Trinidad and Tobago | 0.1 /100 | #277 | Tragic 7.6% |
| Central Americans | 0.1 /100 | #278 | Tragic 7.6% |
| Immigrants | El Salvador | 0.0 /100 | #279 | Tragic 7.6% |
| Immigrants | Sierra Leone | 0.0 /100 | #280 | Tragic 7.7% |
| Immigrants | Laos | 0.0 /100 | #281 | Tragic 7.7% |
| Guatemalans | 0.0 /100 | #282 | Tragic 7.7% |
Demographics Similar to Filipinos by Single Mother Households
In terms of single mother households, the demographic groups most similar to Filipinos are Immigrants from Taiwan (4.7%, a difference of 0.30%), Immigrants from Iran (4.8%, a difference of 2.3%), Assyrian/Chaldean/Syriac (4.8%, a difference of 2.4%), Immigrants from Hong Kong (4.8%, a difference of 3.0%), and Immigrants from Singapore (5.0%, a difference of 5.6%).
| Demographics | Rating | Rank | Single Mother Households |
| Immigrants | Taiwan | 100.0 /100 | #1 | Exceptional 4.7% |
| Filipinos | 100.0 /100 | #2 | Exceptional 4.7% |
| Immigrants | Iran | 100.0 /100 | #3 | Exceptional 4.8% |
| Assyrians/Chaldeans/Syriacs | 100.0 /100 | #4 | Exceptional 4.8% |
| Immigrants | Hong Kong | 100.0 /100 | #5 | Exceptional 4.8% |
| Immigrants | Singapore | 100.0 /100 | #6 | Exceptional 5.0% |
| Iranians | 100.0 /100 | #7 | Exceptional 5.0% |
| Immigrants | Ireland | 99.9 /100 | #8 | Exceptional 5.0% |
| Okinawans | 99.9 /100 | #9 | Exceptional 5.0% |
| Immigrants | Israel | 99.9 /100 | #10 | Exceptional 5.0% |
| Immigrants | China | 99.9 /100 | #11 | Exceptional 5.1% |
| Cypriots | 99.9 /100 | #12 | Exceptional 5.1% |
| Immigrants | India | 99.9 /100 | #13 | Exceptional 5.1% |
| Immigrants | Australia | 99.9 /100 | #14 | Exceptional 5.1% |
| Immigrants | Eastern Asia | 99.9 /100 | #15 | Exceptional 5.1% |