Cape Verdean vs Chippewa Single Father Households
COMPARE
Cape Verdean
Chippewa
Single Father Households
Single Father Households Comparison
Cape Verdeans
Chippewa
2.9%
SINGLE FATHER HOUSEHOLDS
0.0/ 100
METRIC RATING
318th/ 347
METRIC RANK
3.1%
SINGLE FATHER HOUSEHOLDS
0.0/ 100
METRIC RATING
329th/ 347
METRIC RANK
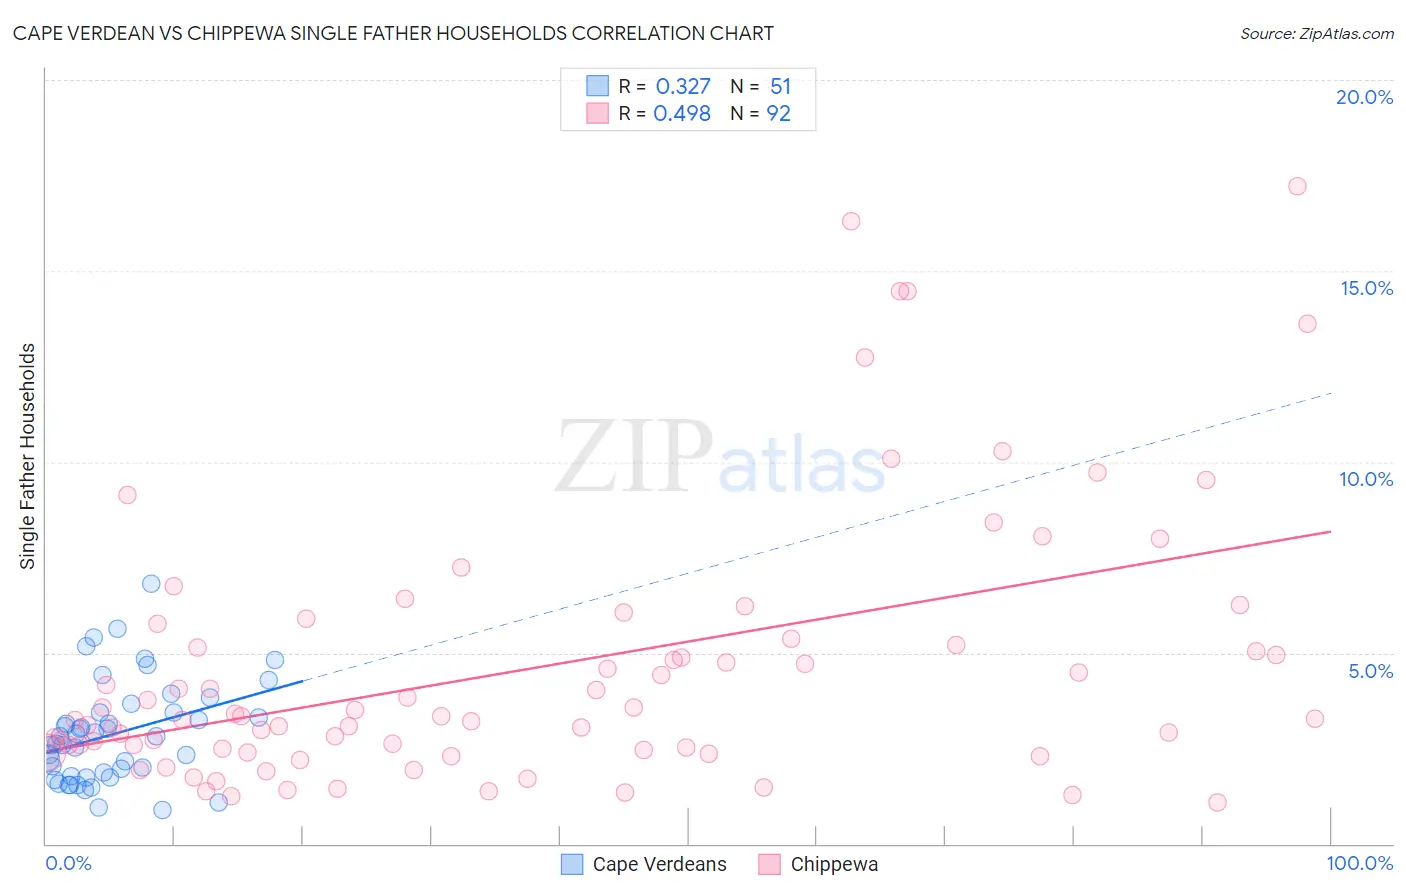
Cape Verdean vs Chippewa Single Father Households Correlation Chart
The statistical analysis conducted on geographies consisting of 107,168,631 people shows a mild positive correlation between the proportion of Cape Verdeans and percentage of single father households in the United States with a correlation coefficient (R) of 0.327 and weighted average of 2.9%. Similarly, the statistical analysis conducted on geographies consisting of 214,030,064 people shows a moderate positive correlation between the proportion of Chippewa and percentage of single father households in the United States with a correlation coefficient (R) of 0.498 and weighted average of 3.1%, a difference of 4.9%.
Single Father Households Correlation Summary
| Measurement | Cape Verdean | Chippewa |
| Minimum | 0.90% | 1.1% |
| Maximum | 6.8% | 17.2% |
| Range | 5.9% | 16.1% |
| Mean | 2.9% | 4.6% |
| Median | 2.8% | 3.3% |
| Interquartile 25% (IQ1) | 1.8% | 2.5% |
| Interquartile 75% (IQ3) | 3.5% | 5.3% |
| Interquartile Range (IQR) | 1.7% | 2.8% |
| Standard Deviation (Sample) | 1.3% | 3.5% |
| Standard Deviation (Population) | 1.3% | 3.5% |
Demographics Similar to Cape Verdeans and Chippewa by Single Father Households
In terms of single father households, the demographic groups most similar to Cape Verdeans are Immigrants from El Salvador (2.9%, a difference of 0.010%), Ute (3.0%, a difference of 0.53%), Guatemalan (3.0%, a difference of 0.61%), Cheyenne (2.9%, a difference of 0.87%), and Houma (2.9%, a difference of 0.87%). Similarly, the demographic groups most similar to Chippewa are Immigrants from Cabo Verde (3.1%, a difference of 0.10%), Bangladeshi (3.1%, a difference of 0.65%), Nepalese (3.1%, a difference of 0.88%), Aleut (3.0%, a difference of 1.5%), and Immigrants from Mexico (3.0%, a difference of 1.7%).
| Demographics | Rating | Rank | Single Father Households |
| Arapaho | 0.0 /100 | #313 | Tragic 2.9% |
| Salvadorans | 0.0 /100 | #314 | Tragic 2.9% |
| Cheyenne | 0.0 /100 | #315 | Tragic 2.9% |
| Houma | 0.0 /100 | #316 | Tragic 2.9% |
| Immigrants | El Salvador | 0.0 /100 | #317 | Tragic 2.9% |
| Cape Verdeans | 0.0 /100 | #318 | Tragic 2.9% |
| Ute | 0.0 /100 | #319 | Tragic 3.0% |
| Guatemalans | 0.0 /100 | #320 | Tragic 3.0% |
| Mexicans | 0.0 /100 | #321 | Tragic 3.0% |
| Immigrants | Guatemala | 0.0 /100 | #322 | Tragic 3.0% |
| Immigrants | Central America | 0.0 /100 | #323 | Tragic 3.0% |
| Fijians | 0.0 /100 | #324 | Tragic 3.0% |
| Immigrants | Mexico | 0.0 /100 | #325 | Tragic 3.0% |
| Aleuts | 0.0 /100 | #326 | Tragic 3.0% |
| Bangladeshis | 0.0 /100 | #327 | Tragic 3.1% |
| Immigrants | Cabo Verde | 0.0 /100 | #328 | Tragic 3.1% |
| Chippewa | 0.0 /100 | #329 | Tragic 3.1% |
| Nepalese | 0.0 /100 | #330 | Tragic 3.1% |
| Navajo | 0.0 /100 | #331 | Tragic 3.2% |
| Yaqui | 0.0 /100 | #332 | Tragic 3.2% |
| Natives/Alaskans | 0.0 /100 | #333 | Tragic 3.2% |