Cajun vs Chinese Family Households with Children
COMPARE
Cajun
Chinese
Family Households with Children
Family Households with Children Comparison
Cajuns
Chinese
27.7%
FAMILY HOUSEHOLDS WITH CHILDREN
87.6/ 100
METRIC RATING
130th/ 347
METRIC RANK
26.0%
FAMILY HOUSEHOLDS WITH CHILDREN
0.0/ 100
METRIC RATING
324th/ 347
METRIC RANK
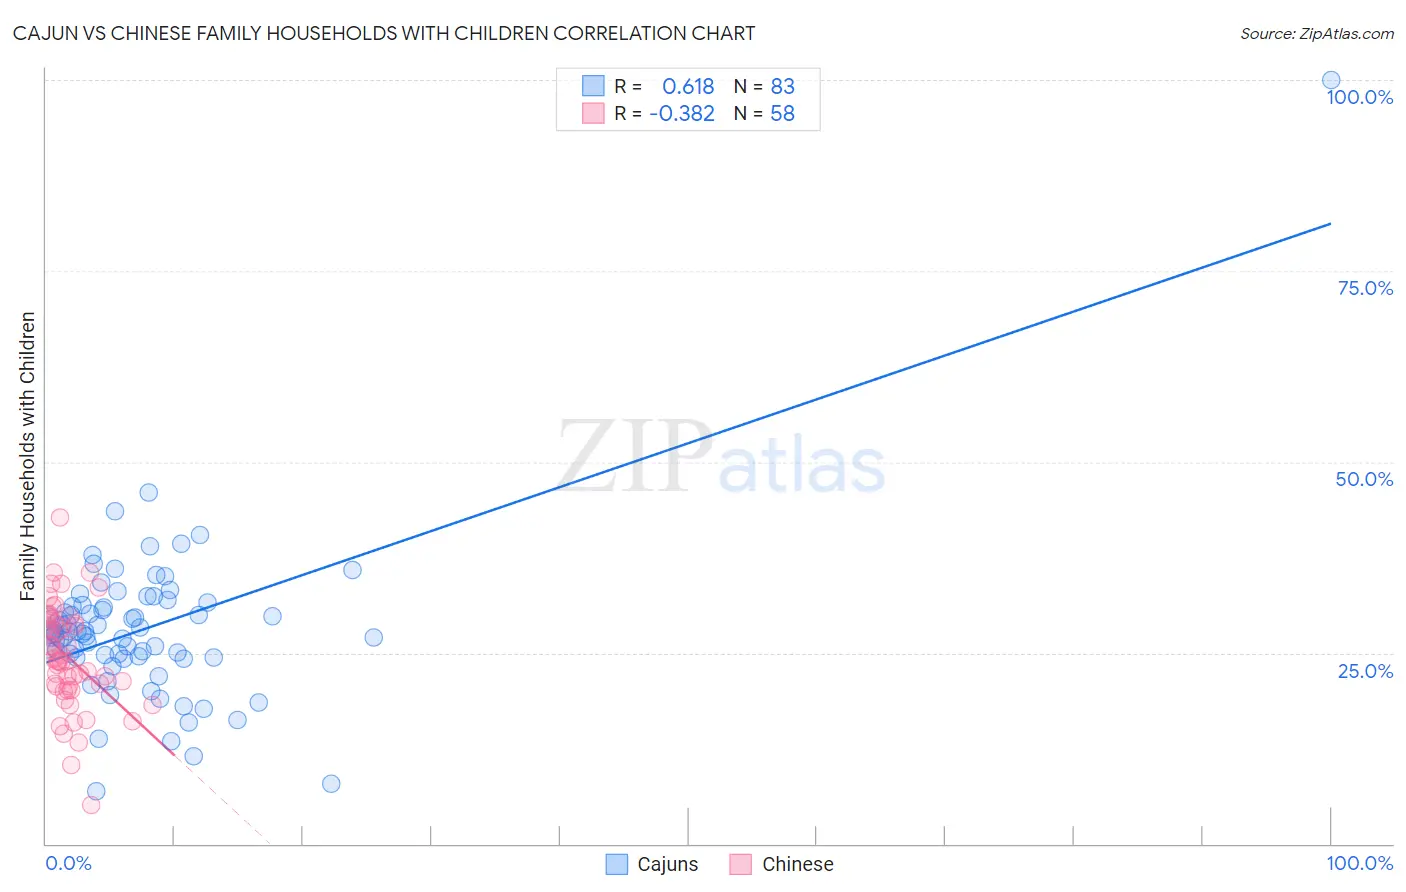
Cajun vs Chinese Family Households with Children Correlation Chart
The statistical analysis conducted on geographies consisting of 149,693,835 people shows a significant positive correlation between the proportion of Cajuns and percentage of family households with children in the United States with a correlation coefficient (R) of 0.618 and weighted average of 27.7%. Similarly, the statistical analysis conducted on geographies consisting of 64,800,060 people shows a mild negative correlation between the proportion of Chinese and percentage of family households with children in the United States with a correlation coefficient (R) of -0.382 and weighted average of 26.0%, a difference of 6.7%.
Family Households with Children Correlation Summary
| Measurement | Cajun | Chinese |
| Minimum | 6.8% | 5.1% |
| Maximum | 100.0% | 42.8% |
| Range | 93.2% | 37.7% |
| Mean | 28.1% | 24.4% |
| Median | 27.5% | 24.0% |
| Interquartile 25% (IQ1) | 24.4% | 20.6% |
| Interquartile 75% (IQ3) | 31.2% | 28.8% |
| Interquartile Range (IQR) | 6.7% | 8.2% |
| Standard Deviation (Sample) | 10.7% | 6.8% |
| Standard Deviation (Population) | 10.7% | 6.7% |
Similar Demographics by Family Households with Children
Demographics Similar to Cajuns by Family Households with Children
In terms of family households with children, the demographic groups most similar to Cajuns are Lebanese (27.7%, a difference of 0.010%), Immigrants from Eritrea (27.8%, a difference of 0.090%), Immigrants from Belize (27.7%, a difference of 0.090%), Syrian (27.8%, a difference of 0.11%), and Iranian (27.7%, a difference of 0.11%).
| Demographics | Rating | Rank | Family Households with Children |
| Immigrants | Northern Africa | 91.8 /100 | #123 | Exceptional 27.8% |
| Immigrants | Singapore | 90.8 /100 | #124 | Exceptional 27.8% |
| Ecuadorians | 90.8 /100 | #125 | Exceptional 27.8% |
| Immigrants | Ethiopia | 90.5 /100 | #126 | Exceptional 27.8% |
| Belizeans | 90.0 /100 | #127 | Exceptional 27.8% |
| Syrians | 89.7 /100 | #128 | Excellent 27.8% |
| Immigrants | Eritrea | 89.4 /100 | #129 | Excellent 27.8% |
| Cajuns | 87.6 /100 | #130 | Excellent 27.7% |
| Lebanese | 87.4 /100 | #131 | Excellent 27.7% |
| Immigrants | Belize | 85.7 /100 | #132 | Excellent 27.7% |
| Iranians | 85.2 /100 | #133 | Excellent 27.7% |
| Immigrants | Panama | 84.9 /100 | #134 | Excellent 27.7% |
| Immigrants | Ecuador | 84.6 /100 | #135 | Excellent 27.7% |
| Immigrants | Portugal | 84.1 /100 | #136 | Excellent 27.7% |
| Immigrants | Dominican Republic | 83.9 /100 | #137 | Excellent 27.7% |
Demographics Similar to Chinese by Family Households with Children
In terms of family households with children, the demographic groups most similar to Chinese are Immigrants from Australia (26.0%, a difference of 0.030%), Barbadian (26.0%, a difference of 0.060%), Immigrants from Greece (26.0%, a difference of 0.070%), British West Indian (26.0%, a difference of 0.080%), and Immigrants from Ireland (26.0%, a difference of 0.080%).
| Demographics | Rating | Rank | Family Households with Children |
| Ottawa | 0.0 /100 | #317 | Tragic 26.1% |
| Iroquois | 0.0 /100 | #318 | Tragic 26.1% |
| Immigrants | France | 0.0 /100 | #319 | Tragic 26.0% |
| Tlingit-Haida | 0.0 /100 | #320 | Tragic 26.0% |
| British West Indians | 0.0 /100 | #321 | Tragic 26.0% |
| Immigrants | Greece | 0.0 /100 | #322 | Tragic 26.0% |
| Immigrants | Australia | 0.0 /100 | #323 | Tragic 26.0% |
| Chinese | 0.0 /100 | #324 | Tragic 26.0% |
| Barbadians | 0.0 /100 | #325 | Tragic 26.0% |
| Immigrants | Ireland | 0.0 /100 | #326 | Tragic 26.0% |
| Immigrants | Barbados | 0.0 /100 | #327 | Tragic 26.0% |
| Immigrants | Albania | 0.0 /100 | #328 | Tragic 25.9% |
| Cypriots | 0.0 /100 | #329 | Tragic 25.9% |
| Immigrants | Latvia | 0.0 /100 | #330 | Tragic 25.9% |
| Slovenes | 0.0 /100 | #331 | Tragic 25.8% |