Belgian vs French Family Households
COMPARE
Belgian
French
Family Households
Family Households Comparison
Belgians
French
63.8%
FAMILY HOUSEHOLDS
7.6/ 100
METRIC RATING
215th/ 347
METRIC RANK
64.0%
FAMILY HOUSEHOLDS
23.7/ 100
METRIC RATING
193rd/ 347
METRIC RANK
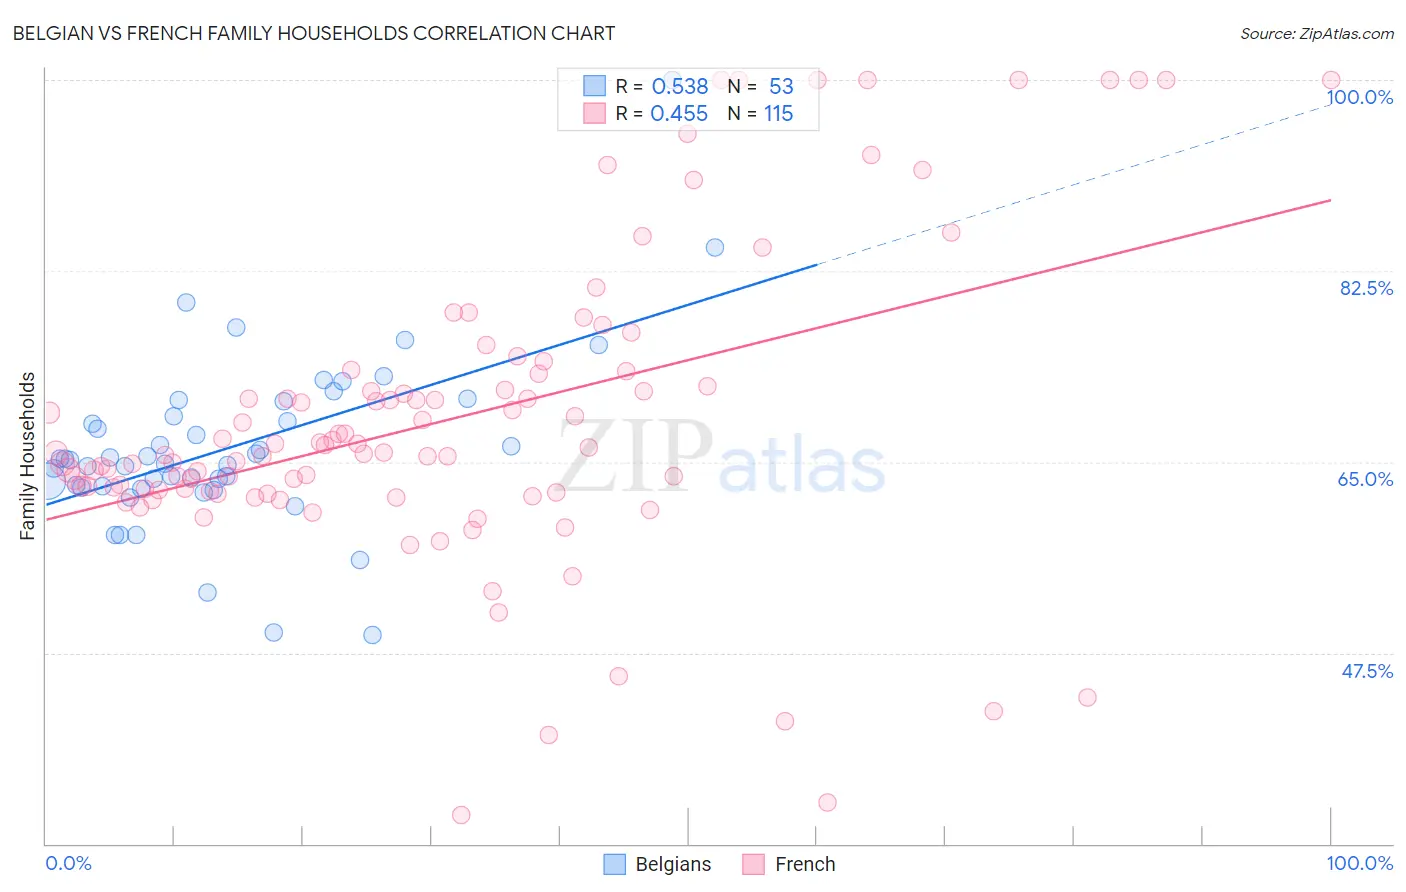
Belgian vs French Family Households Correlation Chart
The statistical analysis conducted on geographies consisting of 355,849,592 people shows a substantial positive correlation between the proportion of Belgians and percentage of family households in the United States with a correlation coefficient (R) of 0.538 and weighted average of 63.8%. Similarly, the statistical analysis conducted on geographies consisting of 571,815,050 people shows a moderate positive correlation between the proportion of French and percentage of family households in the United States with a correlation coefficient (R) of 0.455 and weighted average of 64.0%, a difference of 0.45%.
Family Households Correlation Summary
| Measurement | Belgian | French |
| Minimum | 49.1% | 32.6% |
| Maximum | 100.0% | 100.0% |
| Range | 50.9% | 67.4% |
| Mean | 66.3% | 68.9% |
| Median | 65.2% | 65.8% |
| Interquartile 25% (IQ1) | 62.7% | 62.3% |
| Interquartile 75% (IQ3) | 69.8% | 73.1% |
| Interquartile Range (IQR) | 7.1% | 10.8% |
| Standard Deviation (Sample) | 8.1% | 13.9% |
| Standard Deviation (Population) | 8.1% | 13.9% |
Similar Demographics by Family Households
Demographics Similar to Belgians by Family Households
In terms of family households, the demographic groups most similar to Belgians are Celtic (63.8%, a difference of 0.020%), Croatian (63.8%, a difference of 0.020%), Osage (63.7%, a difference of 0.030%), Marshallese (63.7%, a difference of 0.030%), and Immigrants from Northern Europe (63.8%, a difference of 0.060%).
| Demographics | Rating | Rank | Family Households |
| Immigrants | Bangladesh | 11.4 /100 | #208 | Poor 63.9% |
| Sierra Leoneans | 11.2 /100 | #209 | Poor 63.9% |
| Immigrants | Thailand | 9.6 /100 | #210 | Tragic 63.8% |
| Shoshone | 9.4 /100 | #211 | Tragic 63.8% |
| Immigrants | Netherlands | 9.4 /100 | #212 | Tragic 63.8% |
| Immigrants | Northern Europe | 8.8 /100 | #213 | Tragic 63.8% |
| Celtics | 8.0 /100 | #214 | Tragic 63.8% |
| Belgians | 7.6 /100 | #215 | Tragic 63.8% |
| Croatians | 7.3 /100 | #216 | Tragic 63.8% |
| Osage | 7.0 /100 | #217 | Tragic 63.7% |
| Marshallese | 6.9 /100 | #218 | Tragic 63.7% |
| Macedonians | 6.5 /100 | #219 | Tragic 63.7% |
| Immigrants | Europe | 6.4 /100 | #220 | Tragic 63.7% |
| Immigrants | South Africa | 5.9 /100 | #221 | Tragic 63.7% |
| Immigrants | Belarus | 5.5 /100 | #222 | Tragic 63.7% |
Demographics Similar to French by Family Households
In terms of family households, the demographic groups most similar to French are Lithuanian (64.0%, a difference of 0.0%), Arab (64.1%, a difference of 0.010%), Zimbabwean (64.1%, a difference of 0.020%), Immigrants from Western Asia (64.1%, a difference of 0.030%), and Paiute (64.0%, a difference of 0.030%).
| Demographics | Rating | Rank | Family Households |
| Spanish Americans | 30.1 /100 | #186 | Fair 64.1% |
| Northern Europeans | 28.2 /100 | #187 | Fair 64.1% |
| Paraguayans | 26.7 /100 | #188 | Fair 64.1% |
| Immigrants | Western Asia | 25.3 /100 | #189 | Fair 64.1% |
| Zimbabweans | 24.7 /100 | #190 | Fair 64.1% |
| Arabs | 24.5 /100 | #191 | Fair 64.1% |
| Lithuanians | 23.8 /100 | #192 | Fair 64.0% |
| French | 23.7 /100 | #193 | Fair 64.0% |
| Paiute | 22.2 /100 | #194 | Fair 64.0% |
| Immigrants | North America | 20.0 /100 | #195 | Poor 64.0% |
| Immigrants | Canada | 19.2 /100 | #196 | Poor 64.0% |
| Seminole | 18.9 /100 | #197 | Poor 64.0% |
| Poles | 18.9 /100 | #198 | Poor 64.0% |
| Slavs | 18.6 /100 | #199 | Poor 64.0% |
| Immigrants | Malaysia | 17.9 /100 | #200 | Poor 64.0% |