Apache vs Immigrants from South Central Asia Divorced or Separated
COMPARE
Apache
Immigrants from South Central Asia
Divorced or Separated
Divorced or Separated Comparison
Apache
Immigrants from South Central Asia
12.9%
DIVORCED OR SEPARATED
0.0/ 100
METRIC RATING
294th/ 347
METRIC RANK
10.4%
DIVORCED OR SEPARATED
100.0/ 100
METRIC RATING
11th/ 347
METRIC RANK
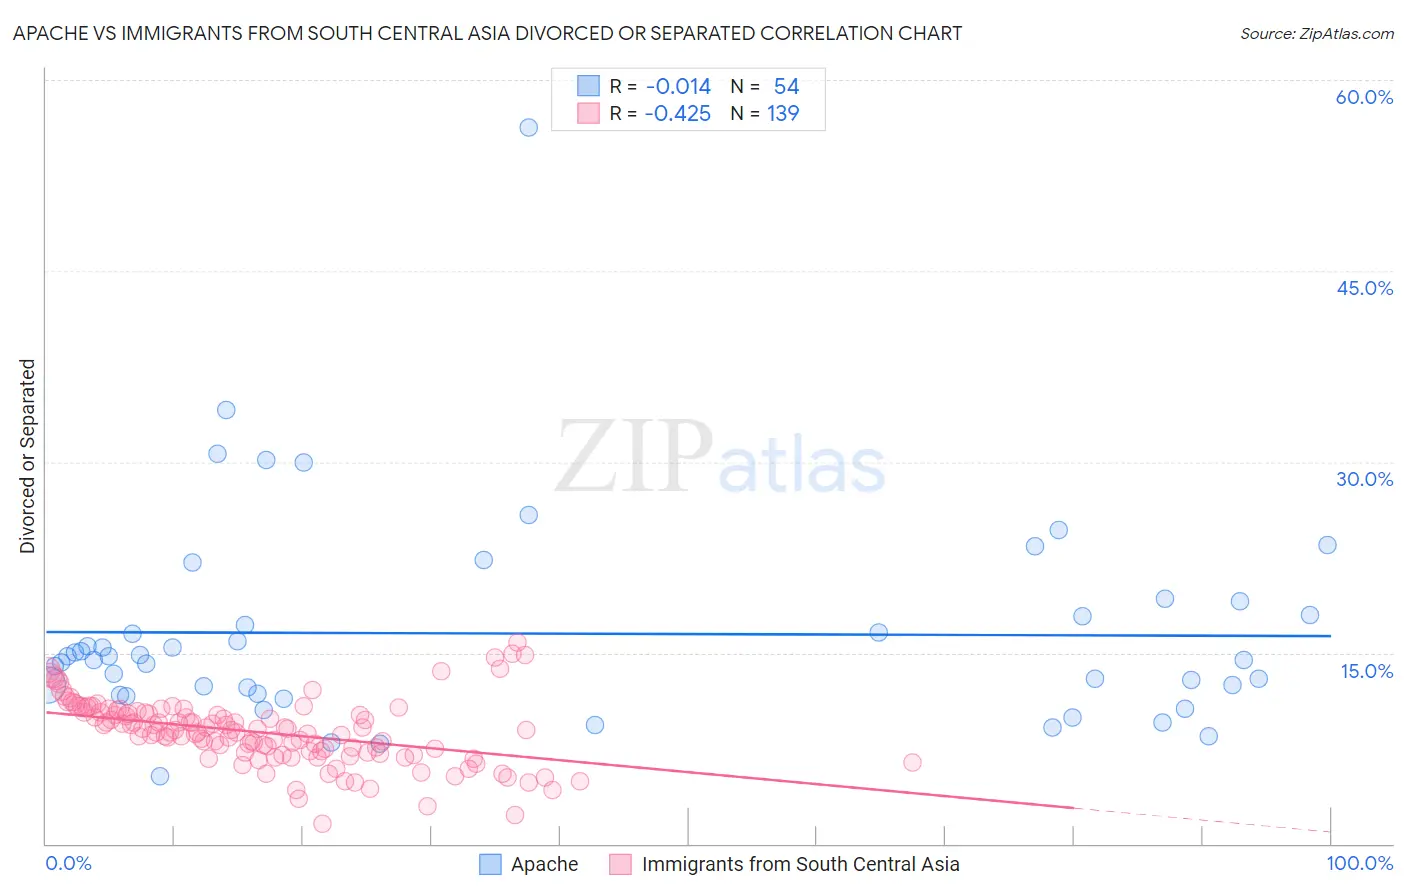
Apache vs Immigrants from South Central Asia Divorced or Separated Correlation Chart
The statistical analysis conducted on geographies consisting of 231,111,519 people shows no correlation between the proportion of Apache and percentage of population currently divorced or separated in the United States with a correlation coefficient (R) of -0.014 and weighted average of 12.9%. Similarly, the statistical analysis conducted on geographies consisting of 472,795,215 people shows a moderate negative correlation between the proportion of Immigrants from South Central Asia and percentage of population currently divorced or separated in the United States with a correlation coefficient (R) of -0.425 and weighted average of 10.4%, a difference of 24.0%.
Divorced or Separated Correlation Summary
| Measurement | Apache | Immigrants from South Central Asia |
| Minimum | 5.3% | 1.6% |
| Maximum | 56.3% | 15.8% |
| Range | 51.0% | 14.2% |
| Mean | 16.5% | 8.8% |
| Median | 14.6% | 8.9% |
| Interquartile 25% (IQ1) | 11.8% | 7.2% |
| Interquartile 75% (IQ3) | 18.0% | 10.3% |
| Interquartile Range (IQR) | 6.2% | 3.2% |
| Standard Deviation (Sample) | 8.3% | 2.6% |
| Standard Deviation (Population) | 8.2% | 2.6% |
Similar Demographics by Divorced or Separated
Demographics Similar to Apache by Divorced or Separated
In terms of divorced or separated, the demographic groups most similar to Apache are Jamaican (12.9%, a difference of 0.030%), Celtic (13.0%, a difference of 0.13%), Scotch-Irish (12.9%, a difference of 0.24%), Immigrants from Honduras (12.9%, a difference of 0.30%), and Pima (12.9%, a difference of 0.41%).
| Demographics | Rating | Rank | Divorced or Separated |
| Hondurans | 0.1 /100 | #287 | Tragic 12.8% |
| French Canadians | 0.1 /100 | #288 | Tragic 12.8% |
| Iroquois | 0.0 /100 | #289 | Tragic 12.9% |
| Pima | 0.0 /100 | #290 | Tragic 12.9% |
| Immigrants | Honduras | 0.0 /100 | #291 | Tragic 12.9% |
| Scotch-Irish | 0.0 /100 | #292 | Tragic 12.9% |
| Jamaicans | 0.0 /100 | #293 | Tragic 12.9% |
| Apache | 0.0 /100 | #294 | Tragic 12.9% |
| Celtics | 0.0 /100 | #295 | Tragic 13.0% |
| Nicaraguans | 0.0 /100 | #296 | Tragic 13.0% |
| Natives/Alaskans | 0.0 /100 | #297 | Tragic 13.0% |
| Venezuelans | 0.0 /100 | #298 | Tragic 13.0% |
| Immigrants | Jamaica | 0.0 /100 | #299 | Tragic 13.0% |
| Immigrants | Cabo Verde | 0.0 /100 | #300 | Tragic 13.1% |
| Alaskan Athabascans | 0.0 /100 | #301 | Tragic 13.1% |
Demographics Similar to Immigrants from South Central Asia by Divorced or Separated
In terms of divorced or separated, the demographic groups most similar to Immigrants from South Central Asia are Okinawan (10.5%, a difference of 0.34%), Cypriot (10.5%, a difference of 0.49%), Immigrants from Singapore (10.3%, a difference of 0.91%), Assyrian/Chaldean/Syriac (10.6%, a difference of 1.2%), and Immigrants from Armenia (10.6%, a difference of 1.3%).
| Demographics | Rating | Rank | Divorced or Separated |
| Immigrants | China | 100.0 /100 | #4 | Exceptional 10.0% |
| Immigrants | India | 100.0 /100 | #5 | Exceptional 10.1% |
| Indians (Asian) | 100.0 /100 | #6 | Exceptional 10.2% |
| Thais | 100.0 /100 | #7 | Exceptional 10.2% |
| Immigrants | Eastern Asia | 100.0 /100 | #8 | Exceptional 10.2% |
| Yup'ik | 100.0 /100 | #9 | Exceptional 10.3% |
| Immigrants | Singapore | 100.0 /100 | #10 | Exceptional 10.3% |
| Immigrants | South Central Asia | 100.0 /100 | #11 | Exceptional 10.4% |
| Okinawans | 100.0 /100 | #12 | Exceptional 10.5% |
| Cypriots | 100.0 /100 | #13 | Exceptional 10.5% |
| Assyrians/Chaldeans/Syriacs | 100.0 /100 | #14 | Exceptional 10.6% |
| Immigrants | Armenia | 100.0 /100 | #15 | Exceptional 10.6% |
| Immigrants | Korea | 100.0 /100 | #16 | Exceptional 10.6% |
| Immigrants | Israel | 100.0 /100 | #17 | Exceptional 10.6% |
| Immigrants | Iran | 100.0 /100 | #18 | Exceptional 10.6% |