Zimbabwean vs Immigrants from Yemen 7th Grade
COMPARE
Zimbabwean
Immigrants from Yemen
7th Grade
7th Grade Comparison
Zimbabweans
Immigrants from Yemen
96.8%
7TH GRADE
99.5/ 100
METRIC RATING
75th/ 347
METRIC RANK
92.6%
7TH GRADE
0.0/ 100
METRIC RATING
334th/ 347
METRIC RANK
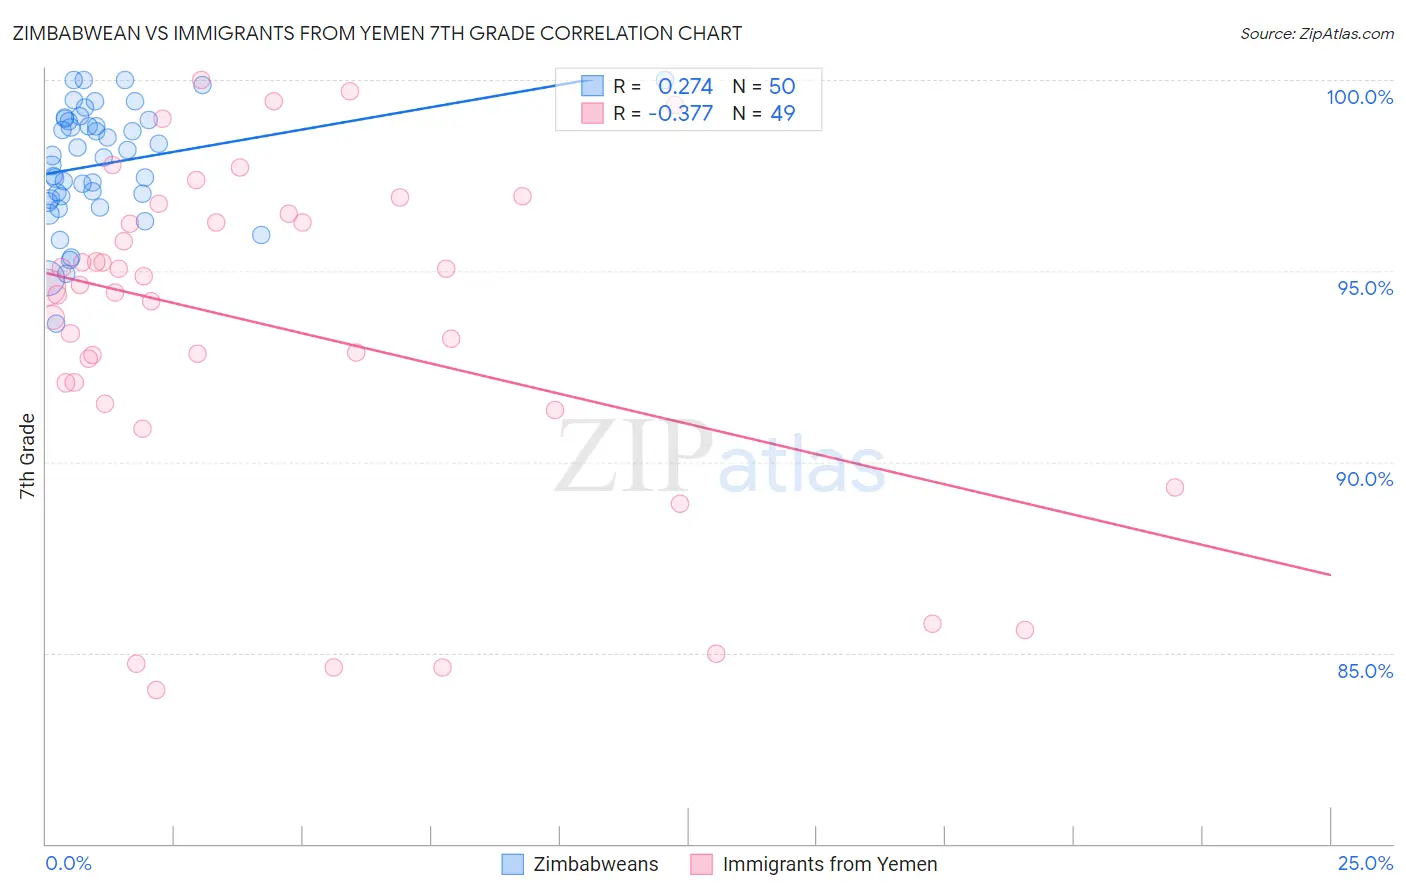
Zimbabwean vs Immigrants from Yemen 7th Grade Correlation Chart
The statistical analysis conducted on geographies consisting of 69,201,950 people shows a weak positive correlation between the proportion of Zimbabweans and percentage of population with at least 7th grade education in the United States with a correlation coefficient (R) of 0.274 and weighted average of 96.8%. Similarly, the statistical analysis conducted on geographies consisting of 82,429,885 people shows a mild negative correlation between the proportion of Immigrants from Yemen and percentage of population with at least 7th grade education in the United States with a correlation coefficient (R) of -0.377 and weighted average of 92.6%, a difference of 4.5%.
7th Grade Correlation Summary
| Measurement | Zimbabwean | Immigrants from Yemen |
| Minimum | 93.6% | 84.0% |
| Maximum | 100.0% | 100.0% |
| Range | 6.4% | 16.0% |
| Mean | 97.8% | 93.5% |
| Median | 98.0% | 94.6% |
| Interquartile 25% (IQ1) | 96.9% | 91.8% |
| Interquartile 75% (IQ3) | 98.9% | 96.4% |
| Interquartile Range (IQR) | 2.1% | 4.6% |
| Standard Deviation (Sample) | 1.5% | 4.3% |
| Standard Deviation (Population) | 1.5% | 4.3% |
Similar Demographics by 7th Grade
Demographics Similar to Zimbabweans by 7th Grade
In terms of 7th grade, the demographic groups most similar to Zimbabweans are Immigrants from England (96.8%, a difference of 0.0%), Arapaho (96.8%, a difference of 0.010%), Immigrants from Ireland (96.8%, a difference of 0.020%), Cherokee (96.8%, a difference of 0.020%), and Cajun (96.8%, a difference of 0.030%).
| Demographics | Rating | Rank | 7th Grade |
| Immigrants | India | 99.6 /100 | #68 | Exceptional 96.9% |
| Iranians | 99.6 /100 | #69 | Exceptional 96.8% |
| New Zealanders | 99.6 /100 | #70 | Exceptional 96.8% |
| Immigrants | Lithuania | 99.6 /100 | #71 | Exceptional 96.8% |
| Cajuns | 99.5 /100 | #72 | Exceptional 96.8% |
| Arapaho | 99.5 /100 | #73 | Exceptional 96.8% |
| Immigrants | England | 99.5 /100 | #74 | Exceptional 96.8% |
| Zimbabweans | 99.5 /100 | #75 | Exceptional 96.8% |
| Immigrants | Ireland | 99.4 /100 | #76 | Exceptional 96.8% |
| Cherokee | 99.4 /100 | #77 | Exceptional 96.8% |
| Immigrants | Netherlands | 99.3 /100 | #78 | Exceptional 96.8% |
| Cypriots | 99.3 /100 | #79 | Exceptional 96.8% |
| Yugoslavians | 99.3 /100 | #80 | Exceptional 96.8% |
| Delaware | 99.2 /100 | #81 | Exceptional 96.8% |
| Chickasaw | 99.2 /100 | #82 | Exceptional 96.7% |
Demographics Similar to Immigrants from Yemen by 7th Grade
In terms of 7th grade, the demographic groups most similar to Immigrants from Yemen are Immigrants from Armenia (92.7%, a difference of 0.080%), Hispanic or Latino (92.7%, a difference of 0.10%), Mexican American Indian (92.6%, a difference of 0.10%), Immigrants from Honduras (92.5%, a difference of 0.17%), and Honduran (92.9%, a difference of 0.24%).
| Demographics | Rating | Rank | 7th Grade |
| Immigrants | Cabo Verde | 0.0 /100 | #327 | Tragic 93.1% |
| Immigrants | Nicaragua | 0.0 /100 | #328 | Tragic 93.0% |
| Immigrants | Azores | 0.0 /100 | #329 | Tragic 93.0% |
| Immigrants | Dominican Republic | 0.0 /100 | #330 | Tragic 92.9% |
| Hondurans | 0.0 /100 | #331 | Tragic 92.9% |
| Hispanics or Latinos | 0.0 /100 | #332 | Tragic 92.7% |
| Immigrants | Armenia | 0.0 /100 | #333 | Tragic 92.7% |
| Immigrants | Yemen | 0.0 /100 | #334 | Tragic 92.6% |
| Mexican American Indians | 0.0 /100 | #335 | Tragic 92.6% |
| Immigrants | Honduras | 0.0 /100 | #336 | Tragic 92.5% |
| Immigrants | Latin America | 0.0 /100 | #337 | Tragic 92.2% |
| Central Americans | 0.0 /100 | #338 | Tragic 92.1% |
| Mexicans | 0.0 /100 | #339 | Tragic 91.9% |
| Yakama | 0.0 /100 | #340 | Tragic 91.7% |
| Guatemalans | 0.0 /100 | #341 | Tragic 91.7% |