Yup'ik vs Immigrants from Egypt 2nd Grade
COMPARE
Yup'ik
Immigrants from Egypt
2nd Grade
2nd Grade Comparison
Yup'ik
Immigrants from Egypt
99.2%
2ND GRADE
100.0/ 100
METRIC RATING
2nd/ 347
METRIC RANK
97.8%
2ND GRADE
24.4/ 100
METRIC RATING
199th/ 347
METRIC RANK
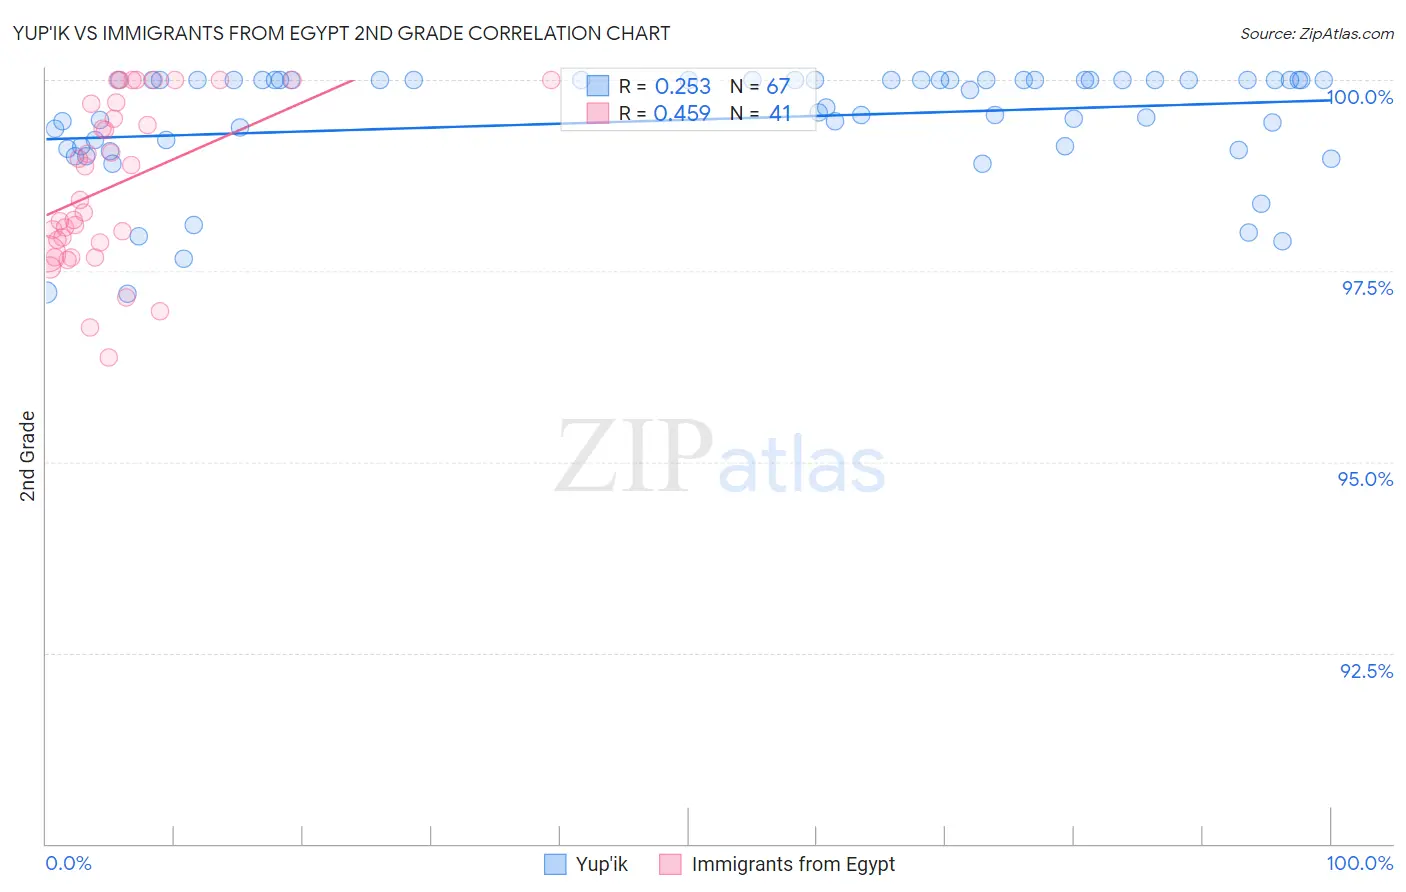
Yup'ik vs Immigrants from Egypt 2nd Grade Correlation Chart
The statistical analysis conducted on geographies consisting of 39,964,464 people shows a weak positive correlation between the proportion of Yup'ik and percentage of population with at least 2nd grade education in the United States with a correlation coefficient (R) of 0.253 and weighted average of 99.2%. Similarly, the statistical analysis conducted on geographies consisting of 245,485,794 people shows a moderate positive correlation between the proportion of Immigrants from Egypt and percentage of population with at least 2nd grade education in the United States with a correlation coefficient (R) of 0.459 and weighted average of 97.8%, a difference of 1.4%.
2nd Grade Correlation Summary
| Measurement | Yup'ik | Immigrants from Egypt |
| Minimum | 97.2% | 96.4% |
| Maximum | 100.0% | 100.0% |
| Range | 2.8% | 3.6% |
| Mean | 99.5% | 98.6% |
| Median | 100.0% | 98.4% |
| Interquartile 25% (IQ1) | 99.1% | 97.8% |
| Interquartile 75% (IQ3) | 100.0% | 99.7% |
| Interquartile Range (IQR) | 0.87% | 1.9% |
| Standard Deviation (Sample) | 0.73% | 1.1% |
| Standard Deviation (Population) | 0.73% | 1.0% |
Similar Demographics by 2nd Grade
Demographics Similar to Yup'ik by 2nd Grade
In terms of 2nd grade, the demographic groups most similar to Yup'ik are Inupiat (98.8%, a difference of 0.31%), Tsimshian (98.8%, a difference of 0.35%), Alaskan Athabascan (98.7%, a difference of 0.43%), Alaska Native (98.7%, a difference of 0.47%), and Norwegian (98.7%, a difference of 0.48%).
| Demographics | Rating | Rank | 2nd Grade |
| Crow | 100.0 /100 | #1 | Exceptional 99.6% |
| Yup'ik | 100.0 /100 | #2 | Exceptional 99.2% |
| Inupiat | 100.0 /100 | #3 | Exceptional 98.8% |
| Tsimshian | 100.0 /100 | #4 | Exceptional 98.8% |
| Alaskan Athabascans | 100.0 /100 | #5 | Exceptional 98.7% |
| Alaska Natives | 100.0 /100 | #6 | Exceptional 98.7% |
| Norwegians | 100.0 /100 | #7 | Exceptional 98.7% |
| Germans | 100.0 /100 | #8 | Exceptional 98.7% |
| Slovaks | 100.0 /100 | #9 | Exceptional 98.7% |
| Slovenes | 100.0 /100 | #10 | Exceptional 98.6% |
| Tlingit-Haida | 100.0 /100 | #11 | Exceptional 98.6% |
| Carpatho Rusyns | 100.0 /100 | #12 | Exceptional 98.6% |
| English | 100.0 /100 | #13 | Exceptional 98.6% |
| Swedes | 100.0 /100 | #14 | Exceptional 98.6% |
| Scottish | 100.0 /100 | #15 | Exceptional 98.6% |
Demographics Similar to Immigrants from Egypt by 2nd Grade
In terms of 2nd grade, the demographic groups most similar to Immigrants from Egypt are Paiute (97.8%, a difference of 0.010%), Mongolian (97.8%, a difference of 0.010%), Immigrants from Kenya (97.8%, a difference of 0.010%), Immigrants from Uganda (97.8%, a difference of 0.010%), and Guamanian/Chamorro (97.8%, a difference of 0.010%).
| Demographics | Rating | Rank | 2nd Grade |
| Blacks/African Americans | 29.9 /100 | #192 | Fair 97.8% |
| Hawaiians | 28.5 /100 | #193 | Fair 97.8% |
| Paiute | 27.0 /100 | #194 | Fair 97.8% |
| Mongolians | 26.7 /100 | #195 | Fair 97.8% |
| Immigrants | Kenya | 26.4 /100 | #196 | Fair 97.8% |
| Immigrants | Uganda | 26.3 /100 | #197 | Fair 97.8% |
| Guamanians/Chamorros | 25.7 /100 | #198 | Fair 97.8% |
| Immigrants | Egypt | 24.4 /100 | #199 | Fair 97.8% |
| Immigrants | Lebanon | 20.9 /100 | #200 | Fair 97.8% |
| Tohono O'odham | 20.9 /100 | #201 | Fair 97.8% |
| Immigrants | Ukraine | 20.5 /100 | #202 | Fair 97.8% |
| Yuman | 20.0 /100 | #203 | Fair 97.8% |
| Immigrants | Albania | 18.4 /100 | #204 | Poor 97.8% |
| Immigrants | Southern Europe | 18.1 /100 | #205 | Poor 97.8% |
| Immigrants | Chile | 17.3 /100 | #206 | Poor 97.7% |