Yuman vs Indian (Asian) 3rd Grade
COMPARE
Yuman
Indian (Asian)
3rd Grade
3rd Grade Comparison
Yuman
Indians (Asian)
97.6%
3RD GRADE
8.4/ 100
METRIC RATING
214th/ 347
METRIC RANK
97.4%
3RD GRADE
1.3/ 100
METRIC RATING
243rd/ 347
METRIC RANK
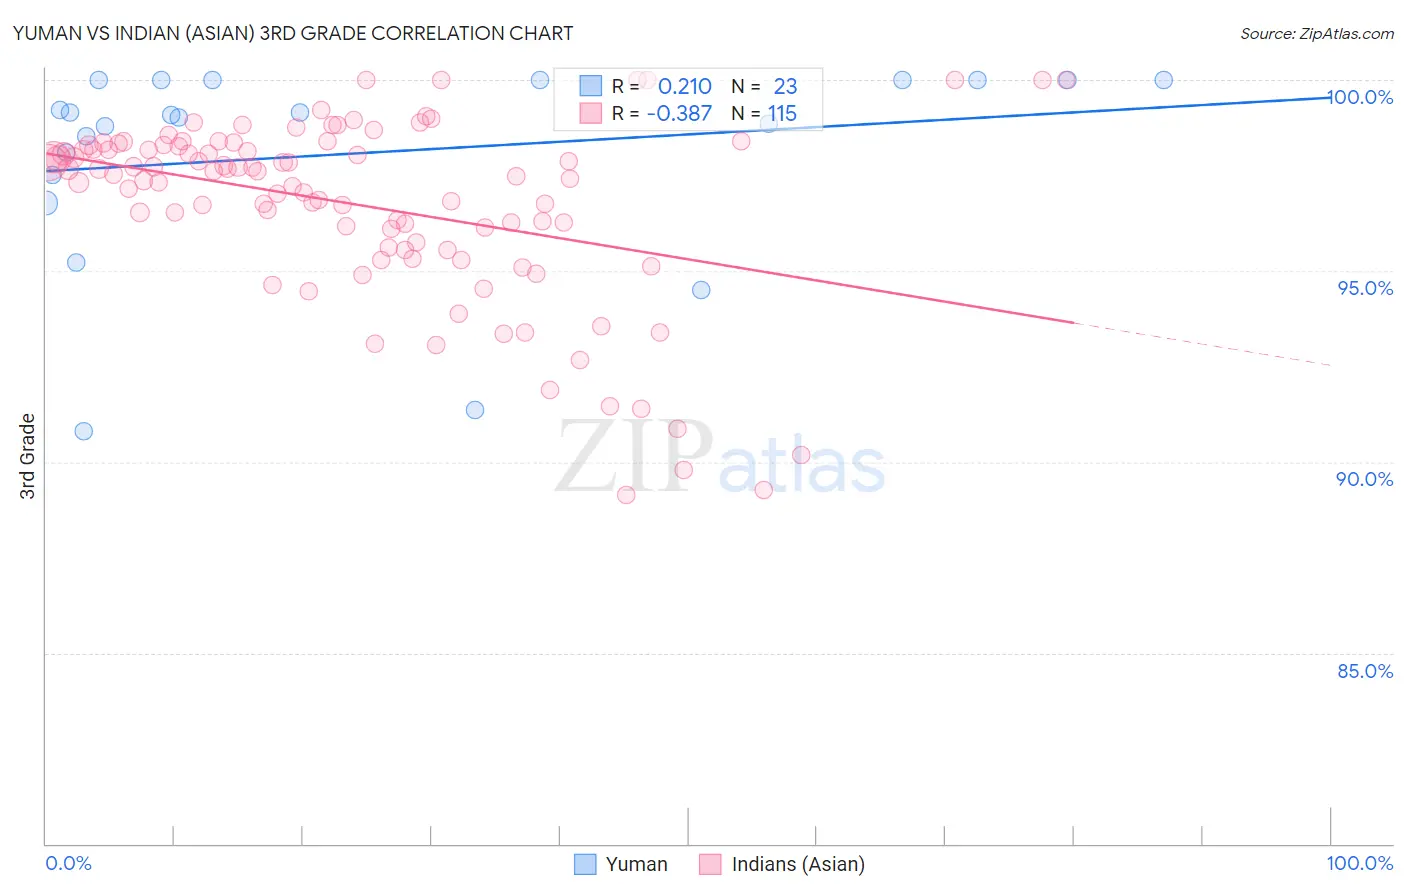
Yuman vs Indian (Asian) 3rd Grade Correlation Chart
The statistical analysis conducted on geographies consisting of 40,696,349 people shows a weak positive correlation between the proportion of Yuman and percentage of population with at least 3rd grade education in the United States with a correlation coefficient (R) of 0.210 and weighted average of 97.6%. Similarly, the statistical analysis conducted on geographies consisting of 495,196,037 people shows a mild negative correlation between the proportion of Indians (Asian) and percentage of population with at least 3rd grade education in the United States with a correlation coefficient (R) of -0.387 and weighted average of 97.4%, a difference of 0.17%.
3rd Grade Correlation Summary
| Measurement | Yuman | Indian (Asian) |
| Minimum | 90.8% | 89.1% |
| Maximum | 100.0% | 100.0% |
| Range | 9.2% | 10.9% |
| Mean | 98.1% | 96.7% |
| Median | 99.1% | 97.5% |
| Interquartile 25% (IQ1) | 97.5% | 95.6% |
| Interquartile 75% (IQ3) | 100.0% | 98.3% |
| Interquartile Range (IQR) | 2.5% | 2.7% |
| Standard Deviation (Sample) | 2.7% | 2.4% |
| Standard Deviation (Population) | 2.6% | 2.4% |
Similar Demographics by 3rd Grade
Demographics Similar to Yuman by 3rd Grade
In terms of 3rd grade, the demographic groups most similar to Yuman are Immigrants from Bahamas (97.6%, a difference of 0.0%), Moroccan (97.6%, a difference of 0.0%), Costa Rican (97.6%, a difference of 0.010%), Immigrants from Oceania (97.6%, a difference of 0.010%), and Laotian (97.6%, a difference of 0.010%).
| Demographics | Rating | Rank | 3rd Grade |
| Tohono O'odham | 12.5 /100 | #207 | Poor 97.6% |
| Immigrants | Zaire | 11.9 /100 | #208 | Poor 97.6% |
| Costa Ricans | 9.6 /100 | #209 | Tragic 97.6% |
| Immigrants | Oceania | 9.5 /100 | #210 | Tragic 97.6% |
| Laotians | 9.4 /100 | #211 | Tragic 97.6% |
| Immigrants | Bahamas | 8.5 /100 | #212 | Tragic 97.6% |
| Moroccans | 8.5 /100 | #213 | Tragic 97.6% |
| Yuman | 8.4 /100 | #214 | Tragic 97.6% |
| Iraqis | 6.9 /100 | #215 | Tragic 97.5% |
| Samoans | 6.9 /100 | #216 | Tragic 97.5% |
| South American Indians | 5.7 /100 | #217 | Tragic 97.5% |
| Immigrants | Nepal | 5.3 /100 | #218 | Tragic 97.5% |
| Immigrants | Panama | 5.2 /100 | #219 | Tragic 97.5% |
| Immigrants | Morocco | 5.0 /100 | #220 | Tragic 97.5% |
| Uruguayans | 5.0 /100 | #221 | Tragic 97.5% |
Demographics Similar to Indians (Asian) by 3rd Grade
In terms of 3rd grade, the demographic groups most similar to Indians (Asian) are U.S. Virgin Islander (97.4%, a difference of 0.010%), Immigrants from Indonesia (97.4%, a difference of 0.010%), Korean (97.4%, a difference of 0.010%), Asian (97.4%, a difference of 0.010%), and Ethiopian (97.4%, a difference of 0.010%).
| Demographics | Rating | Rank | 3rd Grade |
| Liberians | 1.8 /100 | #236 | Tragic 97.4% |
| Colombians | 1.8 /100 | #237 | Tragic 97.4% |
| Immigrants | Uruguay | 1.7 /100 | #238 | Tragic 97.4% |
| Nigerians | 1.6 /100 | #239 | Tragic 97.4% |
| U.S. Virgin Islanders | 1.4 /100 | #240 | Tragic 97.4% |
| Immigrants | Indonesia | 1.4 /100 | #241 | Tragic 97.4% |
| Koreans | 1.3 /100 | #242 | Tragic 97.4% |
| Indians (Asian) | 1.3 /100 | #243 | Tragic 97.4% |
| Asians | 1.1 /100 | #244 | Tragic 97.4% |
| Ethiopians | 1.1 /100 | #245 | Tragic 97.4% |
| Immigrants | Senegal | 1.0 /100 | #246 | Tragic 97.4% |
| Assyrians/Chaldeans/Syriacs | 1.0 /100 | #247 | Tragic 97.4% |
| Immigrants | Eastern Africa | 0.9 /100 | #248 | Tragic 97.4% |
| South Americans | 0.9 /100 | #249 | Tragic 97.4% |
| Immigrants | Middle Africa | 0.9 /100 | #250 | Tragic 97.4% |